
Molly Asher (Leeds Institute for Data Analytics), Simon Brereton (Leeds City Council), and me have recently finished a project whose aim was to analyse footfall in Leeds city centre and build computer models (using machine-learning) that could estimate footfall given some external conditions (e.g. the weather, time of year, whether it was a holiday, etc.). We would like to use a model like this to help the Council with questions like:
- If it is going to rain next Tuesday, how busy will the city be?
- Last Wednesday we organised x, how successful was our event, taking into account that it was cold and rainy?
We’ve yet to compile the final report, but if you’d like any more information about the project (including the data we used and the code that Molly wrote), you can find more details on the main github page. This post will briefly summarise some of the more interesting findings.
Initial Data Analysis
The first stage was to find and analyse the required input data. We brought together:
- Footfall camera data: hourly counts of footfall from a number of locations, published by the Data Mill North
- Weather data: daily temperature, wind, and rainfall, data published by the School of Earth and Environment at the University of Leeds
- Dates for school, university, and public holidays in Leeds
In the future we could find other data sets that might represent factors that influence footfall, such as car parking availability, train prices, etc., but for now we just used the weather and holiday data.
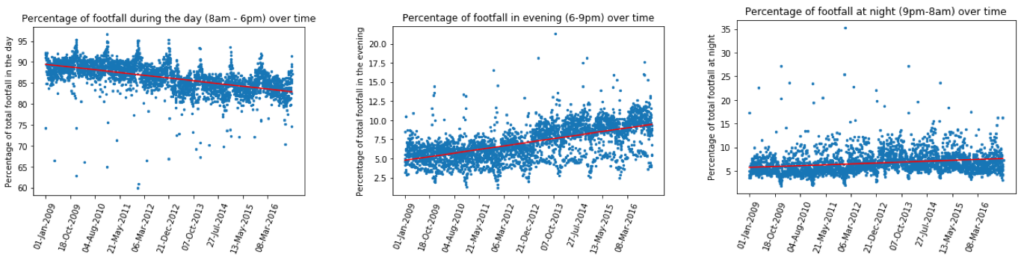
One of the most interesting findings from the first stage in the data analysis was that the times that people use the city centre seem to have changed over the years. For example, the figure below shows how the proportion of people visiting the centre during the day, in the evening, and at night, has changed from 2009. After the opening of the Trinity Shopping Centre in March 2013 there has been a substantial increase in the proportion of people coming to the city centre in the evenings. Shops in the Trinity Centre don’t close before 8pm, which is later than the time that shops in the area traditionally closed, so it seems as if this has encouraged later attendance. Other shops in the area have probably started to stay open later into the evening as well.
Modelling Footfall with Machine Learning
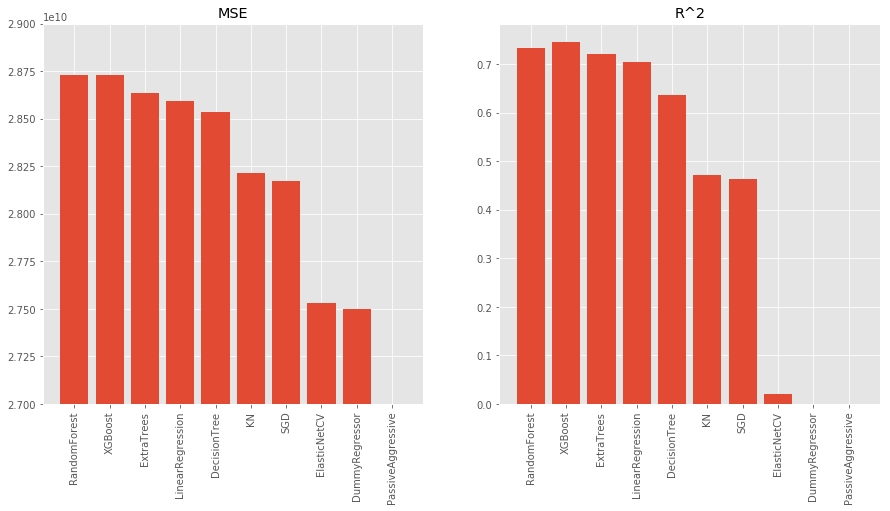
The main aim of the work was to create a model that could predict levels of footfall given some external conditions. We tested a large number of models using the Scikit Learn python library to see which was the best, and in the end a Random Forest model performed the most strongly. Again, for full details about the methodology, data (training, test, validation, etc.) and the code, see our github page.
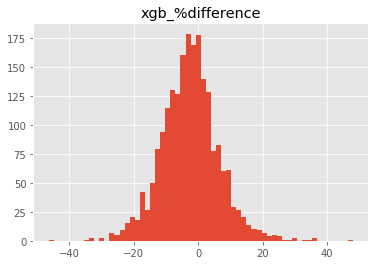
The right figure shows how well the model actually made its predictions. On the whole it behaved reasonably well. Although on some days the predictions were very poor (±20%) the majority are in the range of (±10%).
A benefit with random forest models, over some other machine learning techniques, is that it is possible to extract information about the input parameters (‘features’) that are the most important. This doesn’t tell us whether they are linked with more or less footfall, but does tell us which are the most useful for predicting footfall. The list below shows the top 10. It is important to note that this list is not definitive as there are a number of factors that can affect the importance and if we had chosen another model we would have found slightly different results, but on the whole the variables below were fairly consistent across all of the models tested. The weather variables appear to be the most important, which isn’t especially surprising, but is still interesting.
| Variable | Relative Importance |
| Mean daily temperature | 1142 |
| Mean daily rainfall | 383 |
| Monday | 131 |
| 2013 | 131 |
| Saturday | 130 |
| 2016 | 130 |
| After Trinity opened | 123 |
| Thursday | 122 |
| Tuesday | 116 |
| School holiday | 115 |
Analysing Events
The most useful application of the model is its use as a tool to evaluate how successful previous events in the city were, after taking account of external conditions (day of the week, weather, whether it was a holiday, etc.). For example:
- For the Tour de France Grand Depart on 5th July 2014, there was 37% more footfall in the city centre than we would have expected otherwise
- The Christmas light switch-on (10th Nov 2011) attracted 22% more people than we would have expected).
- The opening of the Trinity centre on 21st March 2013 attracted 33% more footfall.
At the other end of the scale, the model can also help to explain why some days have very low footfall. This occurs during snow, for example, or where other events such as Leeds Festival actually appear to draw people away from the city
The model discussed here is in early stages, and still needs some work to make it more rigorous, but it is clearly a useful tool and one that could provide valuable insight into the drivers of footfall into city centres.