
Analysing hate crime in Lancashire – Police-recorded hate crime
Understanding hate crime is a priority for police forces across England and Wales. Since the EU referendum in June 2016, there has been a renewed emphasis on the importance of preventing hate crime and providing support for victims.
The Home Office reported an increase of 29% in the number of hate crimes recorded between 2015-16 and 2016-17 which represents the largest increase since the Home Office began recording figures in 2011-12. In addition, the Crime Survey for England and Wales (CSEW) has indicated that up to six times as many hate crime incidents occur every year than are reported in police figures.
Our researchers collaborated with Lancashire Constabulary on two projects to improve understanding of hate crime in the local area:
Data and methods
The research was based on the quantitative and spatial analysis of administrative data provided by Lancashire Constabulary. The data comprised the 6,485 police-recorded hate crimes and incidents which took place in Lancashire during the study period (December 2015 – February 2017).
In addition to performing basic descriptive statistics (such as bar charts) to summarise the data, density maps were produced for various towns of Lancashire. Highlighting hot spots of hate incidents, as well as areas populated by a high proportion of victims or offenders.
Key findings
Some of the key findings from the analysis of routinely-captured hate crime police data in Lancashire are:
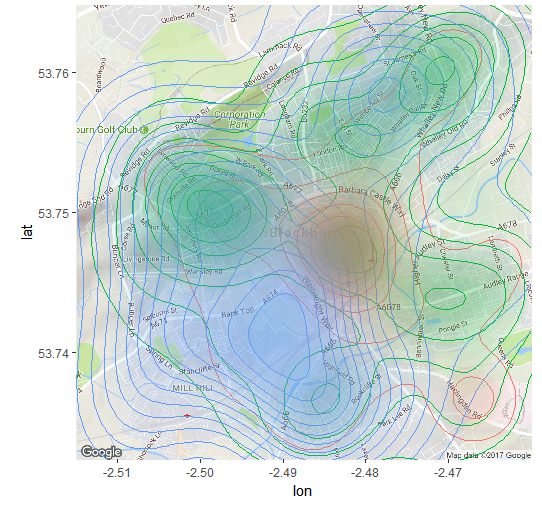
Density map of police-recorded hate in Blackburn.
Red – Hotspots of hate incidents
Blue – Hotspots of offenders’ address
Green – Hotspots of victims address
Impact
The learning from this project has emphasised the valuable information provided by social media data when dealing with under-reported crimes. Twitter produces real-time data which is helpful in generating a spatial and temporal ‘temperature check’ of different localities.
The algorithm developed in this project offers the potential to be used by Lancashire Constabulary to monitor levels of hate, thus ensuring resources can be allocated effectively to respond to emerging community tensions.
Researchers
Natacha Chevenoy, Leeds Institute of Data Analytics and School of Law, University of Leeds
Carly Lightowlers, University of Liverpool
Nick Malleson, Consumer Data Research Centre and School of Geography, University of Leeds
Partners
Lancashire Constabulary
This project was completed as part of the Leeds Institute for Data Analytics internship scheme.