
The Application of Rasch Measurement Theory to Guide Consumer Product Design
Rasch measurement theory provides an innovative way in which to extract insightful information from consumer data.
Project overview
Procter & Gamble is one of the largest consumer goods companies worldwide – specialising in a range of healthcare, homecare and hygiene products. Consumer research is essential to inform product design and development, and Procter & Gamble have a large amount of data in the form of consumer surveys. To analyse this data, classic methods involve statistical modelling in order to spot the overall patterns and trends. In this project, we instead apply Rasch measurement theory (RMT) to the survey data, which is capable of extracting a richer set of information than classic methods.
Data and methods
Two different data sets were provided by Procter & Gamble for analysis. The data consisted of consumer survey responses regarding a variety of different household products. With guidance from my internal supervisor Brian, I applied RMT to the data. RMT is a probabilistic technique that, until recently, has mostly been utilised to assess people in the context of health and education. Using the latter as an example, RMT assumes that the probability of a person answering a question correctly is dependent on two factors only – the ability of the person, and the difficulty of the question. RMT also assumes that the data follow a Guttman pattern, where people with the highest ability are able to answer all questions, while people with lower abilities are only able to answer the easier questions. When we apply RMT we are fitting the data to the Rasch model, as opposed to classic techniques which model the data, and we obtain measurements of people and questions.
So how does this translate to consumer survey data? In this context, the person ability corresponds to the likelihood of a survey participant to endorse the product in question. A person with a high ability is fairly enthusiastic, and more likely to provide positive responses than someone with a lower ability. Instead of questions we have survey statements, and the statement difficulty corresponds to the likelihood of a particular statement to be endorsed. A difficult statement tells us that consumers are not likely to respond positively to it. This could be due to the wording of the statement, or the product feature that the statement refers to.
In addition to the survey participants and statements, additional information (such as the product in question or consumer demographics) can be included in the Rasch model. Statistical analyses (such as Analysis of Variance) can then be performed to determine how different groups respond to the survey.
For the first half of this project, I utilised RMT to analyse consumer survey responses regarding their usual brand of laundry product. I used Python to clean and manipulate the raw data, before fitting the data to the Rasch model with specific RMT software (RUMM2030). In the second half of the project I applied RMT to a second survey data set. These data were obtained in a longitudinal study, where participants performed repeated tests with the same product and responded to a set of statements each time. Each participant repeated the study for a number of different products. The specific details are confidential in the latter case, although the product in question is one that many people use every day. In this study, in addition to the person abilities and statement difficulties, the product itself and the test number may affect the likelihood of product endorsement. The products and tests were therefore also included as variables within RMT, utilising a multi-facet Rasch model. The multi-facet Rasch model produces measurements of people, statements, products and tests.
Key findings
A key benefit of RMT is the ability to pinpoint specific people and statements that do not fit the Rasch model. For example, a person’s responses may be too random, or a survey statement may be unclear and therefore produce inconsistent responses. Misfitting people and statements, who don’t provide us with any useful information, can be easily identified and removed from the analysis. A key finding in this project was that once misfitting people and statements were removed, both sets of data do indeed fit the Rasch model. This tells us that the quality of the data is high, as the survey participants and statements are sufficiently varied in terms of abilities and difficulties. This is essential for a fair assessment in any context.
Regarding the laundry product Rasch analysis, I included the product itself as additional information in order to determine differences amongst users of different products. One major finding from this is that there is significant statistical variation in how different product users regard the overall suds experience when using their product. We found that people who use a certain product (labelled as Product 2), are much more likely to respond positively in terms of their suds experience than users of a different product (labelled as Product 1). This type of information is fundamental in the development of new products.
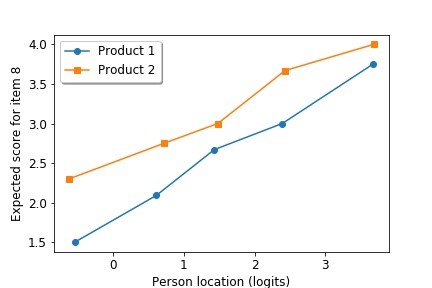
Figure 1: Expected score for Statement 8 (regarding suds experience) against person ability in the laundry product analysis. A higher score corresponds to a more positive response.
The main outcome of the analysis of the second, longitudinal data set is the measurement of different product tests over time. When each test and product are included within the multi-facet Rasch model, we obtain measurements of people, items, products and tests on the Rasch scale. A lower test location corresponds to the test being more likely to result in positive product endorsements than a test with a higher location. The results show that there is a progressive increase in the location of each test on the scale (see Figure 2). In other words, people become more critical with each test. This result is not surprising – the participants are using the same product with each test, which is likely to exhibit a reduced performance with time. The fact that this behaviour can be identified with RMT shows that the method is capable of assessing real, consumer data. Furthermore, product measurements can be obtained whilst taking the test number into account, providing an objective indication of product performance.
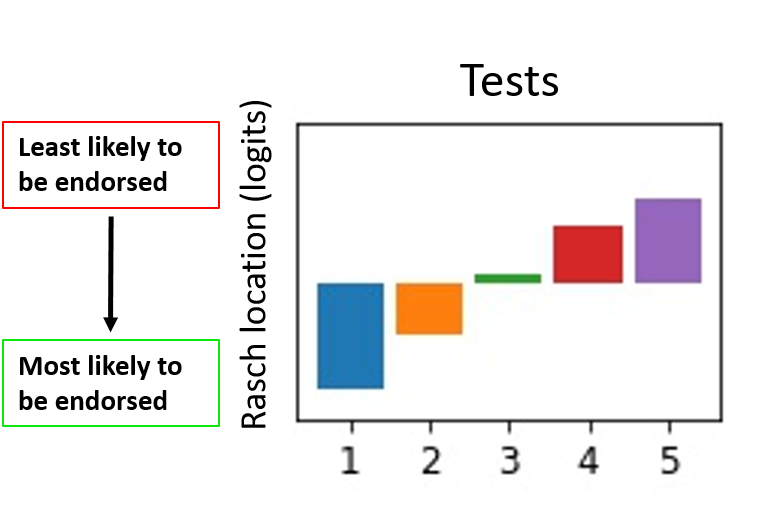
Figure 2: The location of five different tests (on the Rasch measurement scale) with the same product.
Value of the research
What is the impact, how will this benefit xyz? How could the research be applied to real-world problems or what is the usage/benefit?
This research has allowed Procter & Gamble to gain valuable insight into their consumer data, in greater detail than was previously possible. The results have the potential to lead to more efficient surveys, and ultimately guide product design and development. Also, the fact that misfitting people and statements can be easily identified and removed has the potential to reduce costs for businesses in general. Once calibrated, RMT can be reliably administered with smaller sample sizes than those required for classic methods, whilst producing a higher quality of information.
Quote from project partner
“This work has exceeded our expectations in demonstrating how RMT can be used to assess the quality of consumer research data and provide insights into consumer attitudes to products”
Dr Brian Henson, Senior Lecturer, School of Mechanical Engineering, University of Leeds.
Insights
- Rasch measurement theory has been applied to real consumer data for the first time
- We have obtained insightful measurements of people, statements, tests and products
- People and statements that don’t provide us with useful information can be easily identified and removed from the analysis
Research theme
- Consumer research
- Probabilistic methods
People
Caitlin Chalk, Data Science Intern, Leeds Institute for Data Analytics
Brian Henson, Senior Lecturer in Affective Engineering, University of Leeds
Phil Bowtell, Statistician, Procter & Gamble
Sam Whitehead, Senior Scientist, Procter & Gamble
Partners & Funders
Procter & Gamble