
The out of home food industry plays a key role in people’s diet, with demand for online delivery on the rise and adoption of new technologies having increased due to the Covid-19 pandemic. Understanding how people are using online food delivery platforms will go a long way to help us understand developing food behaviours and the digital food environment.
Project overview
In a first of its kind partnership with an online food delivery provider, we have looked at consumer transaction records for online food purchases and how they correlated to census demographic characteristics from the 2021 release.
Data and methods
We used customer transaction data which was provided by a large online food delivery platform, which included a unique customer, order and restaurant identifiers; postcode for the order, delivery, and restaurant; transaction value; primary and secondary restaurant cuisine; order dates; amongst others.
Customer demographics were estimated from census 2021 release at the output area level by matching customers to an output area using order postcode information.
Initial exploratory analysis included summary statistics and Pearson’s correlation of order frequency, median basket price, and different census characteristics.
Different machine learning methods were explored to model consumer behaviour and consumer profiles of order frequency and expenditure including K-means clustering, hierarchical clustering, Ordinary Least Squares (OLS) regression, Principal Components Regression and Partial Least Squares Regression.
Key findings
We explored consumer trends in delivery take away ordering at the output area level (100-250 households) by calculating Pearson’s correlation between median basket price and order density and 2021 census variables.
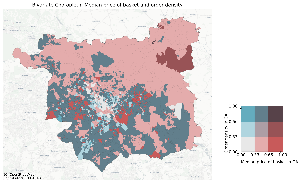
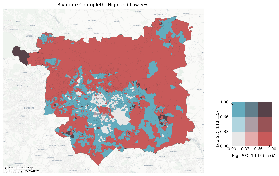
We found that markers of affluence were generally positively associated with median basket spend, whereas they were negatively associated with order frequency. The opposite is also true for markers of deprivation or low economy. We investigated the opposite relationship between median basket spend and order density in Leeds and compared it to the geo-distribution of socio-economic status in Leeds.
We found a north-south divide across Leeds where general areas of high order frequency had lower median basket spend, and they coincided with output areas which had high number of lower socio-economic status households.
We explored the food preferences of high and low median basket spend and order frequency and found that high order frequency and low median basket spend were positively associated with restaurants which primary cuisine type was described as burgers, and negatively correlated with more expensive cuisine types such as Indian or Chinese.
We successfully modelled median basket spend per output areas, explaining 50 percent of the median basket spend, and saw that average car availability per household had the strongest effect in predicting median basket price (30 percent increase in basket price for every 1 unit increase in average car availability). Output area classification was the second most predictive variable.
Value of the research
In 2020, 41 percent of all out of home food expenditure was on food delivery, and the out of home food market is set to continue growing. There is a growing interest in understanding how people make food choices, and this has been difficult due to poor understanding of how consumers are utilising such platforms.
With this piece of research, we are able to understand the demographic profile of online food delivery users. We have also gained an insight into the digital food environment and the factors that affect it. In particular, we have found car ownership to be very strongly associated with usage of online food delivery services. This is an important finding that could be pointing towards an access factor. Further research could investigate this matter to improve access to supermarkets in areas with low car availability.
We suggest that affluence is a major factor in out of home delivery usage, with more affluent populations ordering more expensive cuisine at lower frequencies, whereas low economy areas have a more frequent ordering behaviour with a lower general spend.
The demographic factors that signal affluence are complex, however. Although we have seen some association between them, how these interplay to affect median basket price is still unknown. We have found that affluent areas with higher rates of car access have lower ordering frequency, however, this is not a measure for out of home food consumption as this study is limited to food which is ordered for delivery. A wider study might look at all out of home food orders and understand the relationship between delivery and collection orders.
Insights
- Output areas with high percentage of high skilled workers and higher managerial occupations show lower order frequency.
- Output areas with a higher percentage of older and retired populations are associated with higher median basket price.
- Populations which show a higher order frequency seem to be more likely to order burgers from chain restaurants, whereas populations with higher median basket spend are more likely to order Chinese or Indian cuisine.
- Access measured by car availability and affluence are the most predictive factors in forecasting basket price.
People
- Tamara Garcia del Toro, Data Scientist, LIDA
- Francesca Pontin, Research Data Scientist, Consumer Data Research Centre
- Rachel Oldroyd, Lecturer, School of Geography
- Nik Lomax, Professor, School of Geography & Consumer Data Research Centre
- Stephen Clark, Research Fellow, Consumer Data Research Centre
Funders
Funded by the Consumer Data Research Centre