

Examining Christmas 2020
The UK Christmas 2020 period attracted enormous public attention owing to the late cancellation of the 5-day ‘Christmas bubble’ policy to relax indoor household mixing from Dec 23rd-27th across the UK. Although Independent SAGE warned of the transmission risks from households mixing at Christmas, 44% of ONS survey respondents claimed they formed an exclusive Christmas bubble for Dec 25th.
Understanding human mobility responses has been transformed by the emergence of passively-collected smartphone app data. With most ‘Non-Pharmaceutical Interventions’ to curtail COVID-19 transmission relying upon the modification of physical behaviour [1], public health experts have called for the use of this systematic insight to monitor the effectiveness of national and regional ‘lockdown’ policies [1] [2] [3].
In response to public curiosity, and as a guide for health policymakers, this article provides a timely overview of actual mobility patterns observed over the 2020 Christmas period in the UK and their COVID-19 impacts. Using smartphone mobility data, it attempts to address:
- How mobile was the UK population over the Christmas period (23rd-27th Dec 2020)?
- Were these mobility patterns aligned with the UK government’s revised Christmas policy?
- Did mobility patterns have a detectable effect on UK COVID-19 growth rates?
Data and Methods
For our data source, aggregated mobility data was provided by Cuebiq, a location intelligence and measurement platform. This first-party data is collected from anonymised users who have opted-in to provide access to their location data anonymously, through a CCPA and GDPR-compliant framework. Through its Data for Good program, Cuebiq provides mobility insights for academic research and humanitarian initiatives. Cuebiq’s responsible data sharing framework enables Data for Good partners to query anonymised and privacy-enhanced data, by providing access to an auditable, on-premise sandbox environment. All final outputs provided to partners such as LIDA are aggregated in order to preserve privacy.
Our metrics seek to understand mobility through the recorded ‘destinations’ of devices outside their ‘home’ location area. The ‘home’ areas of users in this analysis were calculated using a frequency-based DBSCAN from the week prior to Christmas. Destinations were then calculated daily for each unique user through a space-time DBSCAN algorithm [4]. The results of these were then aggregated in socio-temporal extent to daily and regional levels, so that the reported results protect privacy.
In order to account for relative mobility during COVID-19, a baseline of 16th December 2020 was used. Figure 1 evaluates the geographic representativeness of the Cuebiq data for 16/12/20, by visualising the UK authorities where the % proportion of the total population in the Cuebiq data outweighs (blue) the equivalent proportion from the ONS 2019 Mid-Year Population Estimates. It demonstrates that although there is good overall geographic representativeness, with no single area 1% over or under its % proportion of the total population, there is also a distinct regional geography to Cuebiq overrepresentation, concentrated in South-East England.
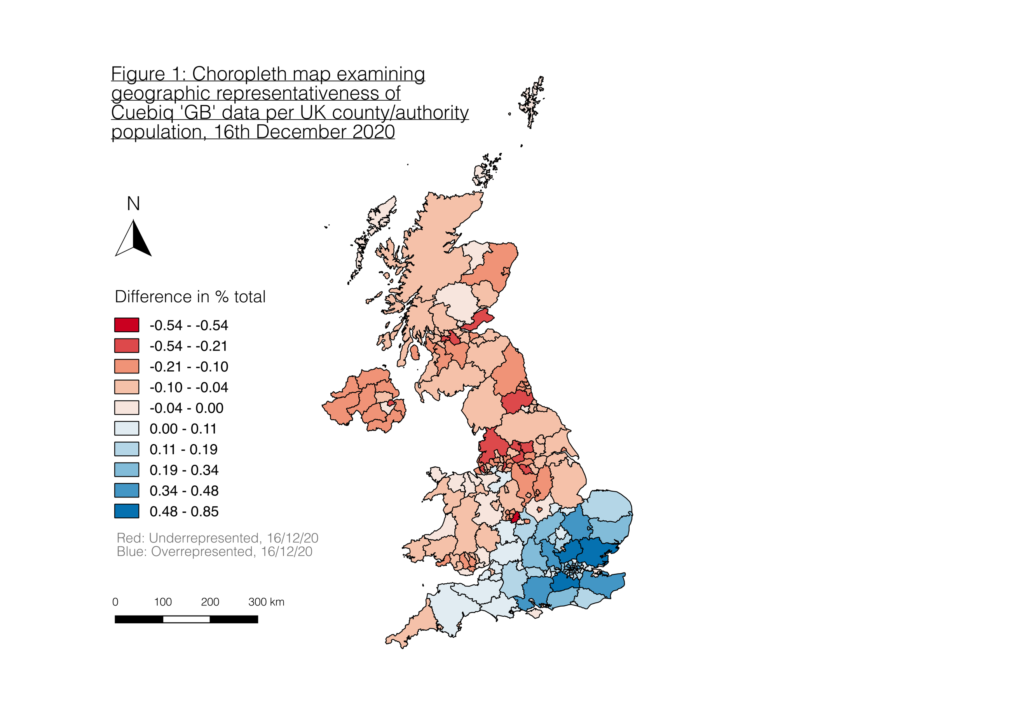
Figure 1: UK choropleth map to evidence representativeness by county of Cuebiq ‘GB’ data, for date 16/12/20. Calculated per county by subtracting % of total population in our Cuebiq dataset by the % proportion of the actual UK population as measured by ONS 2019 Mid-Year Population Estimates. Data Sources: Cuebiq; ONS UK Mid-Year Population Estimates 2019: https://www.ons.gov.uk/peoplepopulationandcommunity/populationandmigration/populationestimates/datasets/populationestimatesforukenglandandwalesscotlandandnorthernireland.
Policy Adherence
Under the final Christmas policy, no household mixing was permitted in Tier 4 England. Elsewhere in Great Britain the 3-household ‘Christmas bubble’ relaxations were limited to Christmas Day only. In Wales, only 2 households could mix on 25th December, whilst in Scotland bubbles were limited to 8 people.
So, did we see the spike of mobility on Christmas Day that we would be expecting, in light of these policies? No.
As Figure 2 evidences by contrast, mean distance travelled per ‘GB’ Cuebiq user actually fell in the lead-up to Christmas Day. There is a clear separation between the baseline (16th) and the entire Christmas period, with mean mobility declining by 40% from 4.5mi to 2.7mi per user on Christmas Day. Furthermore, a second smaller layer of separation exists within the Christmas period itself, within which mean mobility declined by 29% from 3.8mi on 23rd December to 2.7mi on Christmas Day. This noticeable reduction in mobility activity on Christmas Day is unexpected. Though, it is also verifiable insofar as it is reproduced in Citymapper data for Birmingham, Apple Mobility Trends Reports, and Google COVID-19 Community Mobility Reports for the UK.
Furthermore, lower mean mobility is accompanied by a higher % of users not going ‘out’ on an individual day, as well as a higher % of users staying outside their ‘home’ county. As shown by Figure 2, this is again true between both the baseline and the Christmas period, as well as within the 5-day Christmas period itself. A Multiple Comparison of Means test (Tukey HSD) showed a significant difference (P-value < 0.001) between each day’s % homestayers except between the 23rd-24th, and the 25th-26th.
Notably, the % of users outside their home county barely increased by 0.2% between Christmas Eve and Christmas Day, alongside a peak level of users not moving at 65.8%. Further than not just representing an expected Christmas Day spike, the shape of these 5-day figures relative to the 16th December baseline indicate patterns of mobility that are more closely aligned with the previous 5-day ‘Christmas bubble’ policy. On the one hand this could indicate a higher-than-expected uptake of legitimate ‘support bubbles’ for the Christmas period, or a very localised geography to the households that did mix in their scaled-back ‘Christmas bubble’. Nevertheless, these statistics could also support the speculation that adherence to the revised Christmas policy was lower than intended through the policy, with users following the withdrawn 5-day allowance.
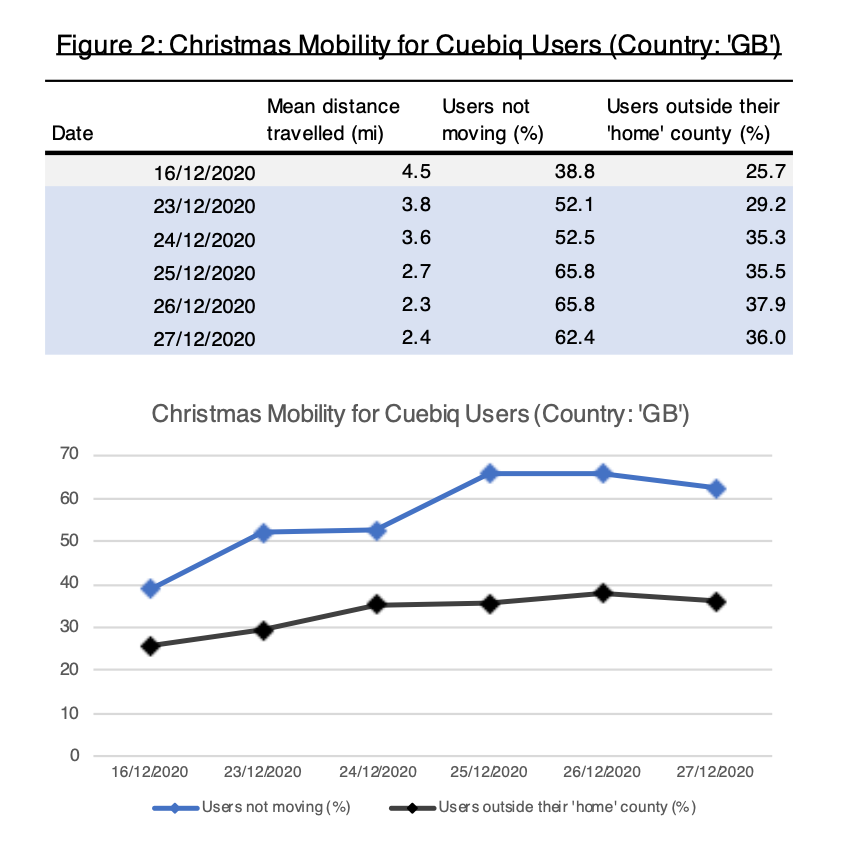
Figure 2: Visualised table documenting GB user mobility statistics, 16th and 23rd-27th Dec 2020. Includes mean distance travelled (mi, 1dp), users not moving (%) and users outside their ‘home’ county (%). Data Source: Cuebiq.
Links to COVID-19 Growth Rate
So, did the British counties with the highest levels of recorded mobility over Christmas experience the consequence of higher COVID-19 incidence in early-January?
For this we’ve employed the proxy metric of ‘COVID-19 Growth Rate’, which is distinct from ‘R’ and is an approximation of the % change in the number of (recorded) infections each day. We’ve taken two measures of mobility from our analysis: total number of destinations visited per county and average number of destinations per individual per day per county.
The graphs in Figure 3 represent the correlations at British county level between measured mobility over the Christmas period 23rd-27th December 2020, and the COVID-19 growth rate as measured for these counties 5th-8th January 2021. As shown, the correlation for both mobility measures is positive but underwhelmingly weak. This counters our expectations that a strong positive correlation would exist.
Though plagued by small sample sizes, the top 5 counties by COVID-19 growth rate saw a dramatic spike in early January, when it was anticipated post-Christmas. Despite this, their mobility is far from the highest observed. This begs the question: were their COVID-19 growth rates a product of visitors from other counties ‘bringing COVID with them’ over Christmas? Our analysis also indicated this to be unlikely. In the two counties with useable sample sizes – Torbay and Stirling – both exhibited amongst their visitors a weighted COVID-19 county growth rate below the national average of 329, at 244.9 and 200.8 respectively. They did however both each receive visitors from one Tier 4 county that was far above the national COVID-19 growth rate average – Hertfordshire (13.5% visitors, 731) and Surrey (6.3% visitors, 603), respectively.
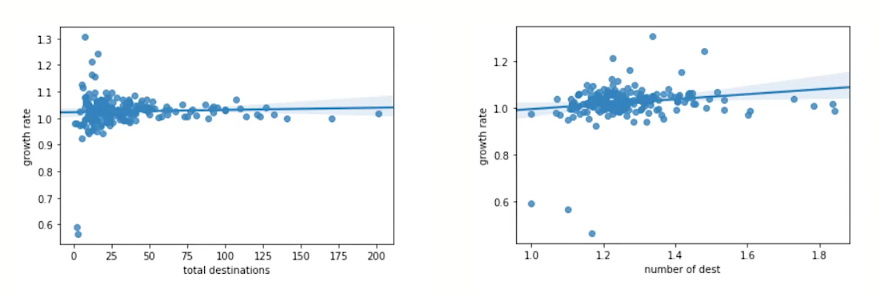
Figure 3: Correlation graphs per British county between Cuebiq mobility 23rd-27th Dec 2020 and COVID-19 Growth Rate for 5th-8th January 2021. Show weak correlations. COVID-19 Data Source: https://coronavirus.data.gov.uk/details/cases.
Despite this, it is very unlikely that mobility didn’t play a leading role in December 2020 COVID-19 transmission. A criticism of smartphone mobility data is that it is still unable to detect the fine-scale behaviours that can significantly reduce differential transmission risks, such as the adoption of sufficient social distancing, the wearing of face masks and whether households were definitively mixing [1] [2]. We are also forced to consider all mobile individuals as equally dangerous for transmission [1]. All factors considered, therefore, this analysis lends credibility to these critiques across a short-term period.
For further information please contact Professor Ed Manley, CDRC Co-Director and Professor of Urban Analytics at the University of Leeds.
References
[1] Grantz, K. H., Meredith, H. R., Cummings, D. A., Metcalf, C. J. E., Grenfell, B. T., Giles, J. R., Mehta, S., Solomon, S., Labrique, A., Kishore, N., Buckee, C. O., & Wesolowski, A. (2020). The use of mobile phone data to inform analysis of COVID-19 pandemic epidemiology. Nature communications, 11(1), 1-8.
[2] Kishore, N., Kiang, M. V., Engø-Monsen, K., Vembar, N., Schroeder, A., Balsari, S., & Buckee, C. O. (2020). Measuring mobility to monitor travel and physical distancing interventions: a common framework for mobile phone data analysis. The Lancet Digital Health.
[3] Budd, J., Miller, B. S., Manning, E. M., Lampos, V., Zhuang, M., Edelstein, M., Rees, G., Emery, V. C., Stevens, M.M., Keegan, N., Short, M. J., Pillay, D., Manley, E., Cox, I.J., Heymann, D., Johnson, A. M., & McKendry, R. A. (2020). Digital technologies in the public-health response to COVID-19. Nature medicine, 26(8), 1183-1192.
[4] Birant, D., & Kut, A. (2007). ST-DBSCAN: An algorithm for clustering spatial–temporal data. Data & knowledge engineering, 60(1), 208-221.