

A new small area ‘e-food deserts index’ (EFDI) produced by the CDRC reveals that food deserts are not solely an urban phenomenon associated with neighbourhood deprivation. Analysis reveals the presence of rural ‘e-food deserts’ – neighbourhoods that suffer a dual disadvantage of poor access to grocery stores alongside comparatively poor provision of groceries home delivery services.
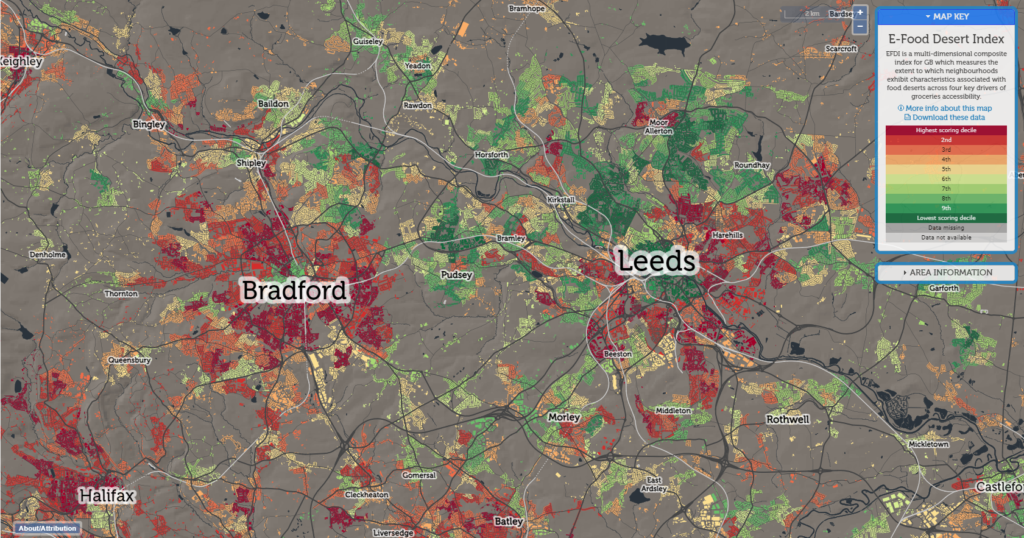
The multi-dimensional composite index for GB measures the extent to which neighbourhoods exhibit characteristics associated with food deserts. It draws upon measures of accessibility to grocery retail facilities, neighbourhood socio-economic, demographic and mobility indicators and also novel measures of e-commerce availability and usage. Interactive maps highlight the EFDI scores for all LSOAs in England & Wales and Data Zones in Scotland. In common with prominent research into urban food deserts in the late 1990s, there is a clear relationship between neighbourhood level deprivation and the presence of food desert-like characteristics in urban areas.
Many of these neighbourhoods benefitted from considerable investment in grocery retail opportunities following the widespread interest in urban food deserts. These investments included large-format store development (such as the Tesco Extra store in Seacroft, South East Leeds constructed as part of a high profile ‘regeneration agenda’). The persistence of food desert-like characteristics in these neighbourhoods highlights the importance of characteristics such as transport availability, household composition (especially the presence of pensioners), personal mobility and income in driving groceries accessibility, all associated with urban deprivation.
The research also highlights new drivers of inequalities in access to groceries between rural areas. In East Anglia for example, the smaller cities of Cambridge (Cambridgeshire) and Ipswich (Suffolk) and the towns of Colchester (Essex) and Bury St Edmunds (Suffolk) fare very favourably on our indicator. These localities benefit from excellent local provision of grocery retail opportunities are not associated with large pockets of urban-deprivation.
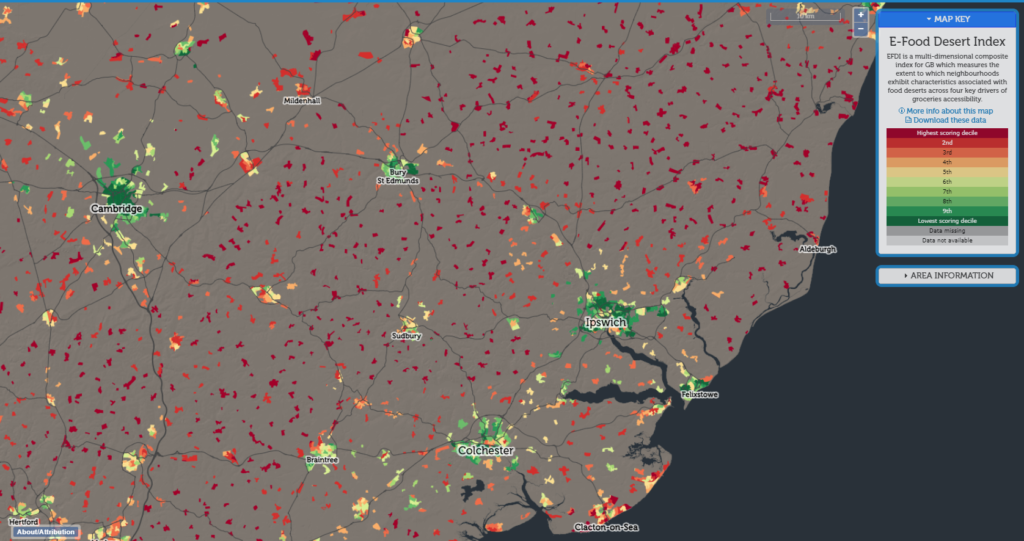
The predominantly rural nature of East Anglia means that outside of these principal urban settlements, many neighbourhoods fare relatively poorly on our index, with a limited presence or choice of proximate physical retail facilities and comparatively poor transport provision. Nevertheless, ranking and scores on our EFDI index are boosted in many of these neighbourhoods by the relatively good coverage of groceries home delivery services in this area. Most neighbourhoods benefit from considerable choice in provider, with most of the major grocers offering coverage among these neighbourhoods for their home delivery services, considerably lessening the barriers to groceries access.
By contrast, in rural mid-wales almost all households fall within our worst scoring decile. Access barriers associated with very limited provision of physical retail opportunities are exacerbated by comparatively poor provision of online groceries – in most cases with no choice of retailer and potentially very limited provision of delivery slots, coupled with a low propensity to shop online among households in many of these neighbourhoods. These areas, which we class as rural e-food deserts suffer from the dual disadvantage of comparatively poor access to physical retail opportunities alongside more limited provision of online groceries (home delivery).
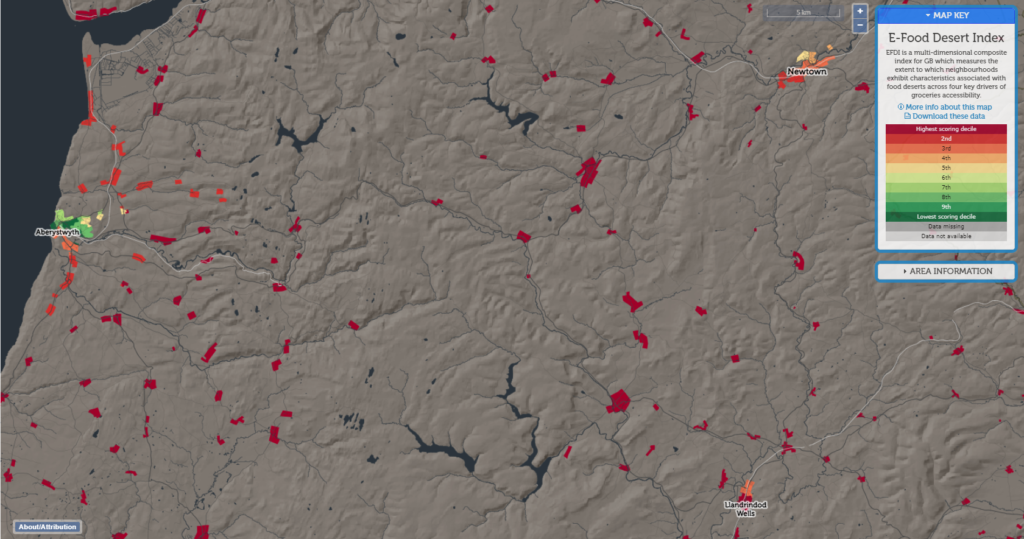
The index highlights the barriers in providing services within some of our most remote and rural areas, where population density doesn’t warrant comprehensive food store provision and where retailers also face considerable costs in providing groceries home delivery services to dispersed populations. We hope this indicator will help to focus attention on these inequalities. The index can be explored via interactive maps available for all LSOAs in England & Wales and Data Zones in Scotland. The data and a more detailed user guide can be downloaded via the CDRC website.