
The Paris Agreement (UNFCCC, 2015) sets long term goals to guide all nations to substantially reduce global greenhouse gas emissions and to pursue efforts to limit global temperature increase to 1.5°C above pre-industrial levels, recognizing that this would significantly reduce the risks and impacts of climate change.
Recent research from CDRC’s Dr Susan Lee and colleagues from the Centre for Climate Change and Social Transformations, published in Frontiers in Sustainable Food Systems, explores how we can use complex data from Integrated Assessment Models (IAMs) to identify dietary shifts that align with these goals, then simplify through visualisation to help people make informed choices about possible lifestyle adjustments.
What is an Integrated Assessment Model?
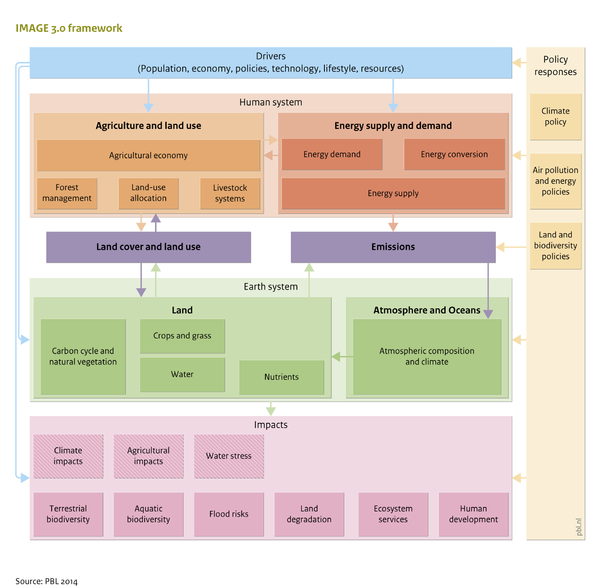
An Integrated Assessment Model (IAM), such as the IMAGE IAM used in this study, is a model that simulates interactions between climate, economy, society and the biosphere to evaluate climate change impacts and develop mitigation policies.
Traditional IAM outputs are incredibly useful to help us understand the impact of dietary shifts, but the complexity of the data and the need for detailed analysis can make them largely inaccessible beyond the research community.
This research explores how visualisation can be used to make these insights more accessible to both diet, nutrition, and sustainability professionals and the wider public.
Translating IAM outputs into accessible visualisations
The researchers systematically examined the impact of modelled changes in food demand on regional diets and dish visualisation.
Their approach involved preparing and interpreting IAM scenario data, establishing food consumption baselines for Sweden, China the UK and Brazil and applying the Diets, Dishes, Dish Ingredients (DDDI) framework* to analyse shifts in food consumption patterns.
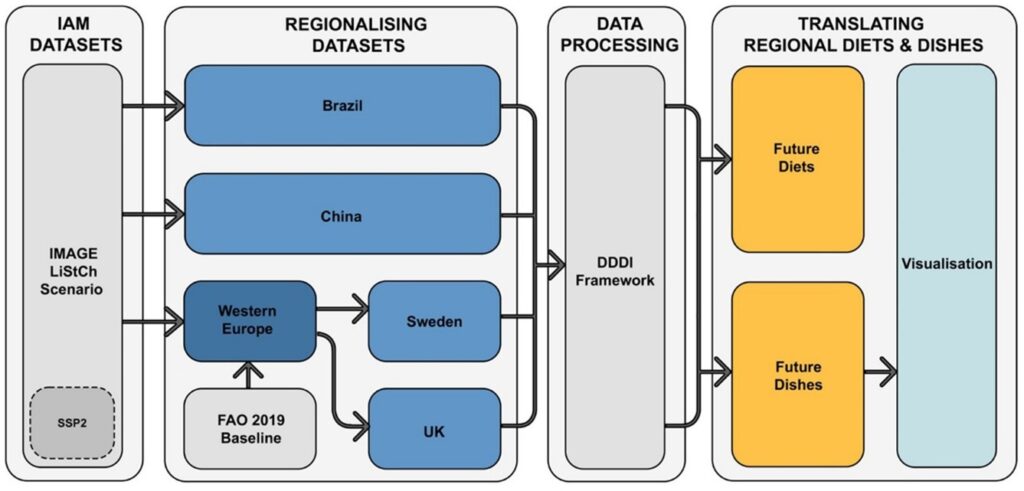
Methodology schematic representing the stages of Integrated Assessment Model (IAM) data processing and translating for the regional diets and dish visualisations.
Visualising current and potential dishes
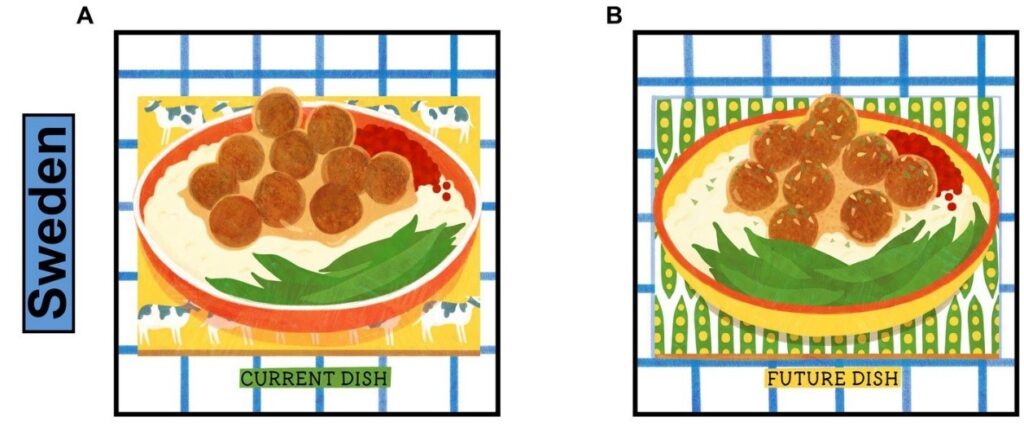
They then worked with a designer to create proportional visual representations of current dishes and potential dishes for 2050 to highlight and better communicate the balance of plant and meat-based foods in potential future diets.
Sweden
Current dish: (Köttbullar) include meatballs comprising of beef and pork which are served with gravy, mashed potatoes, lingonberries, and green beans (A)
Future dish: Meat replaced by lentils, nuts, and seeds, while the proportion of vegetables expands to occupy half the dish by 2050 (B)
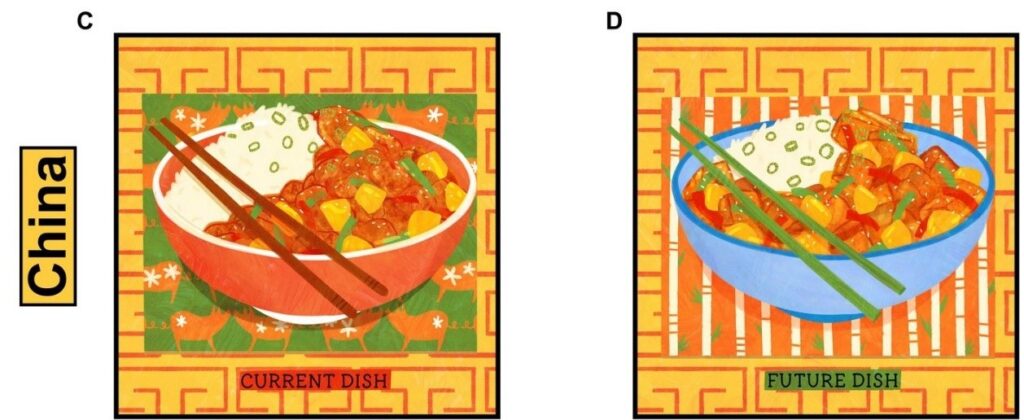
China
Current dish: Sweet and Sour Pork dish includes pork with pineapple, red and green peppers, and onions together with rice. (C)
Future dish: The pork is replaced by tofu (soy curd) (D)
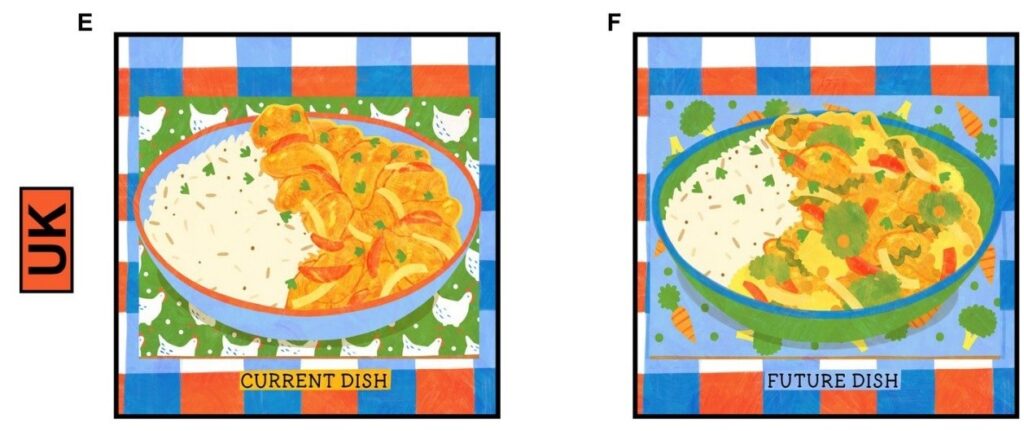
UK
Current dish: Chicken Korma consists of chicken, vegetables (onion, tomatoes, and a sprinkling of coriander) with rice (E)
Future dish: Chicken gradually replaced by pulses (chickpeas and lentils) with the introduction of broccoli to represent the increased vegetable proportion between 2020 and 2050 (F)
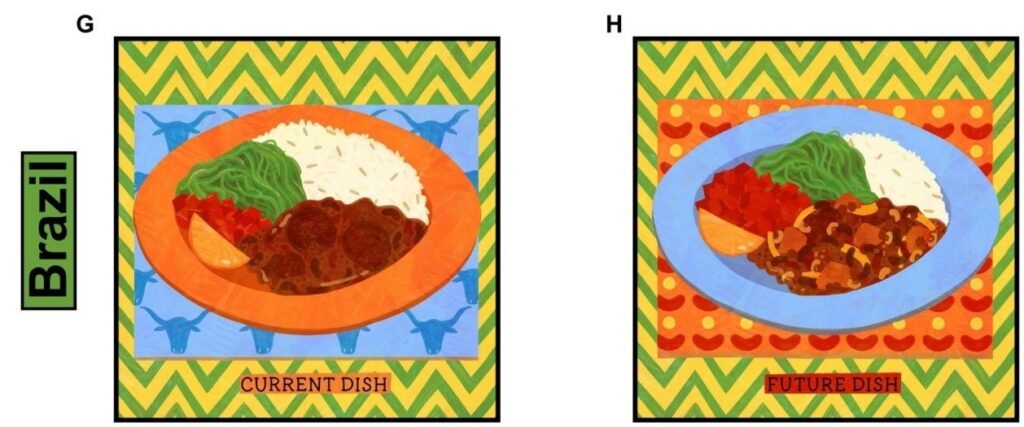
Brazil
Current dish: Feijoada – the dish consists of pork, beef, and beans, and is accompanied by a slice of orange, salsa, pan-fried collard beans (leafy vegetable) with garlic, and rice (G)
Future dish: The 2050’s dish includes sweet potato (considered a staple like rice) and black-eyed peas (pulses) (H).
Overcoming barriers through better communication
Whilst there is still more work to be done in this area, this study represents an effort to make complex dietary transition data more accessible.
Visualisations, like the ones shown above, could be used by diet, nutrition, and sustainability professionals to aid discussions around dietary changes with different communities.
Dr Susan Lee explains ‘We know that the shift in people’s diets will face barriers such as increased food costs, changes in habits and preferences, accessibility of plant-based foods and potential cultural and social barriers that may hinder the shift in diets to tackle climate change. However, the use of visual communication frameworks showcased in this research could help ease the transition to more sustainable diets within communities.’
Read the full publication: From future diets to dishes: communicating dietary shift associated with a 1.5°C scenario for Brazil, China, Sweden and the United Kingdom
*de Boer, J. and H. Aiking, Strategies towards healthy and sustainable protein consumption: A transition framework at the levels of diets, dishes, and dish ingredients. Food Quality and Preference, 2019. 73: p. 171-181.