Priority Places for Food Index
The Priority Places for Food Index (PPFI), developed as a collaboration between the Consumer Data Research Centre (CDRC) and Which?, was launched in 2022 to identify neighbourhoods that are most vulnerable to increases in the cost of living and which are likely to be food insecure.
In January 2024 we launched an updated version of the index, providing the most up-to-date picture of food insecurity risk at neighbourhood level.
What is the Priority Places for Food Index?
In 2022, 14% of households in the UK struggled to access a reliable source of healthy, nutritious and affordable food. However, statistics about food insecurity outcomes, such as those provided by the Trussell Trust, are not captured at individual or neighbourhood level, making it difficult to target specific areas.
Using openly-available data, the Priority Places for Food Index allows food insecurity risk to be mapped at a local level, focusing on areas roughly 650 households in size, across all devolved nations.
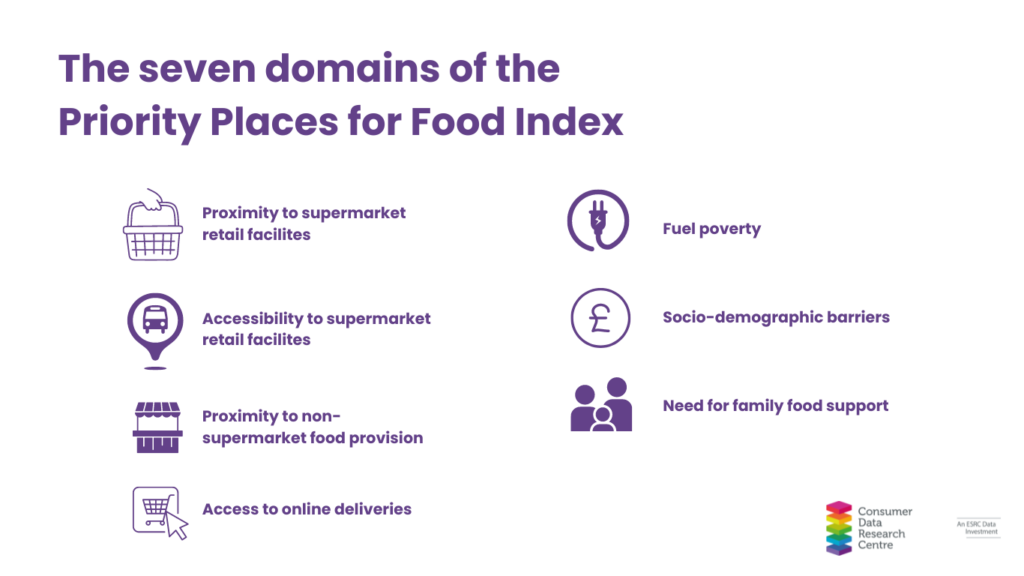
As the index uses seven different data domains, it can be used to identify areas that are a priority for different types of support and where that support needs to be targeted.
Across all nations of the UK, the PPFI is being used by policymakers, academics, charities, retailers, nutritionists, consumer groups, and educators in their efforts to reduce food insecurity. Which? used the Priority Places for Food Index as part of their Affordable Food for All campaign, which calls on supermarkets to commit to clear pricing and better access to budget ranges that enable healthy choices and more offers for those who need them most.
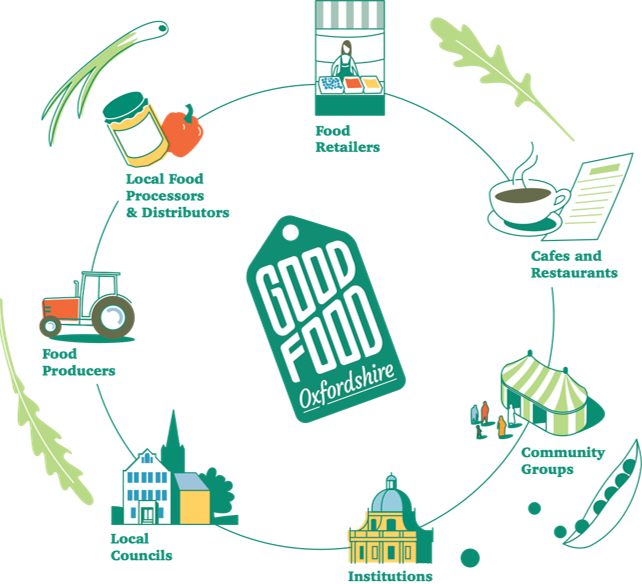
“At Good Food Oxfordshire we’ve worked very closely with the county and district councils to develop and implement a food strategy for Oxfordshire.
The PPFI is a core metric for some of our top priority areas, such as reducing food poverty. We like the PPFI because it’s relevant to us, it’s multi-dimensional – so we can use it holistically or with different dimensions of food insecurity, it’s easy to explain, and it can be tested and developed against our practical realities locally.”
Stuart Newstead, Non-executive director, Good Food Oxfordshire
What’s changed in this version of the Priority Places for Food Index?
Data have been updated across several of the seven PPFI domains. This includes new area socio-demographics, foodbank, and food retailer location data.
Data relating to Free School Meal eligibility has also been updated to reflect the changing policy landscape and to address regional inconsistencies in policies. We now include all children in households of relatively low income, reflecting recommendations that the free school meal program be extended to all children in these households. Just this month, The Mayor of London, Sadiq Khan, extended the funding for universal free school meals as the cost-of-living crisis continues to hit families.
Finally, in England and Wales, the Index has been updated to reflect the latest 2021 census neighbourhood boundaries (Lower layer Super Output Areas). For the full details of the data update see the PPFI version two data profile.

Areas may look different to version one as a result of the new data incorporated or changes to neighbourhood boundaries. Because of these data changes we recommend that you don’t make comparisons between the versions. If you would like to continue to use version one, you can find it here.
You might also notice a few changes to some of the features within the dashboard. Following a year of engagement with charities, local and national government and commercial organisations using the tool we have made a few upgrades to the dashboard to improve the user experience. These tweaks include making it more accessible to those who use assistive technology and adding more detailed ‘how to’ guides on the web page. We have also improved the map navigability, adding a search bar that enables you to ‘zoom to’ your chosen local authority or region of the UK.
Insights from the Priority Places for Food Index
Read Dr Fran Pontin and Dr Rachel Oldroyd’s article in which they highlight diverse examples of high-priority neighbourhoods across England, Wales, and Scotland, illustrating how various factors and barriers can converge to create a ‘perfect storm,’ resulting in households experiencing hunger or being unable to access a balanced, healthy diet.
Where can I find more information?
Full details of the data update can be found in the PPFI version two data profile.
Read a summary of frequently asked questions.
Should you have any questions or wish to provide feedback on the latest version of the Priority Places for Food Index please contact the CDRC Leeds team.


