Cities worldwide are preparing for the long transition out of lockdown. Physical distancing measures will be in place for many months, with impacts on all walks of life, not least transport.
With public transport options running at low capacity and emerging evidence of the role of air quality and exercise in mitigating the risks of COVID-19, solutions are needed more than ever.
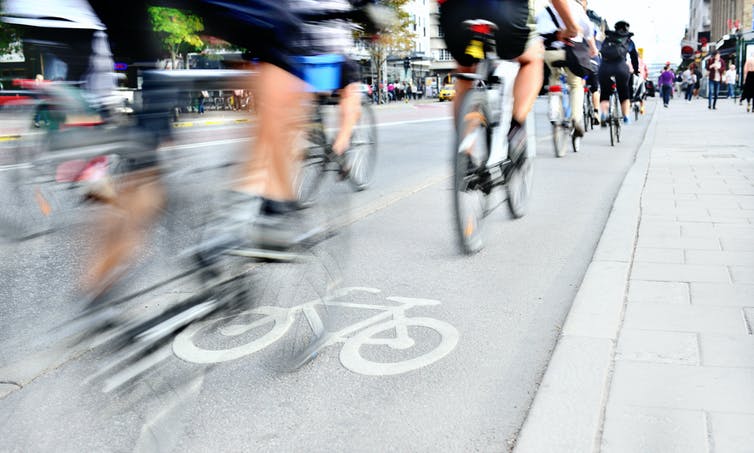
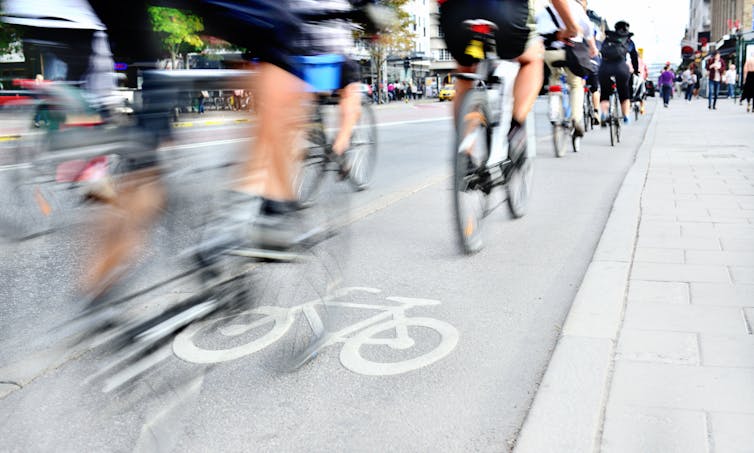
New cycleways are being introduced in many cities, allowing healthy habits started during the lockdown to continue. Transport authorities must act fast, however, to take advantage of the current cycling boom while traffic levels are still below normal, and to avoid gridlock.
New cycleway on space reclaimed from motor traffic as part of the COVID-19 response in Park Lane, London.Transport for London.
Our research at the University of Leeds has identified roads where there is both space and demand for cycling infrastructure.
Our methods have been used in a nationwide project funded by the Department for Transport and transport charity Sustrans to help relieve immediate pressures on the transport system and create long term change. The result is the Rapid Cycleway Prioritisation Tool. This is a free and open tool to help ensure that the government’s Emergency Active Travel Fund is spent where it is most needed, for maximum long term benefit.
New routes
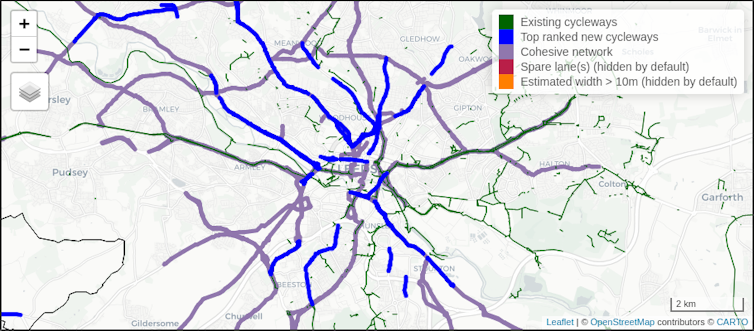
The Rapid Cycleway Prioritisation Tool provides an interactive map for every transport authority in England. The main result is a list of road sections that have both high demand and sufficient space for cycling.
These are represented as blue lines in the map of Leeds below, many of which are included in the council’s new cycleway plans. Additional layers in the map include existing off-road cycleways (shown in green), which in many cities are disjointed or of variable quality, and, in purple, a vision of what a joined-up cycle network could look like.
The map output of the Rapid Cycleway Prioritisation Tool for West Yorkshire, zoomed in on Leeds.University of Leeds
This new tool builds on our previous work, carried out with other universities, to help authorities identify and develop strategic cycle networks. We created a national dataset of roads, including estimates of the number of lanes in either direction and road width.
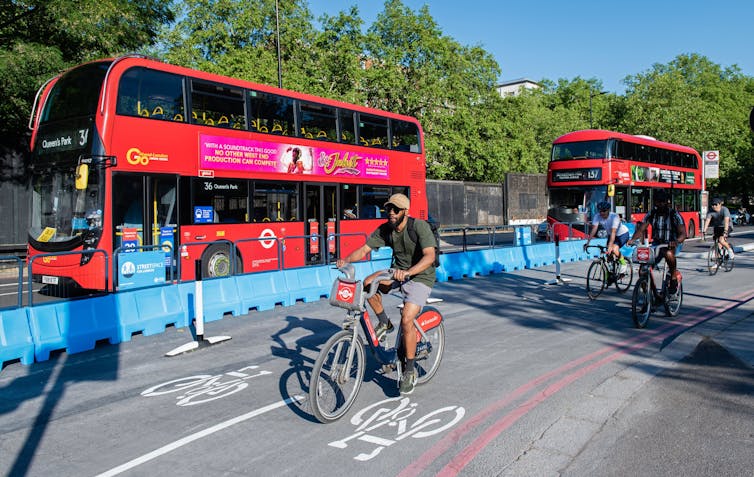
This can help identify where roads have space that could be reallocated to widen pavements or to rapidly introduce new cycleways. One of the first of these has been installed outside a hospital in Leicester. Community engagement through projects such as Widen My Path, which provides a forum for comments on where more space for walking and cycling is most needed, is another vital part of this process.
The tool’s focus on road space reallocation is due to the importance of speed and capacity. Light segregation measures such as plastic bollards or wands can be implemented much faster than constructing new cycleways from scratch. Wide, direct and continuous cycleways, of the type created by road space reallocation on wide roads, are needed for capacity and to ensure physical distancing guidelines can be followed. Finally, road space reallocation has environmental benefits, representing “zero carbon infrastructure”.
An important finding is that many cities have wide roads with spare space, as shown the maps of six major cities below. Notably, none of these yet have a joined-up cycle network. An example of the type of road highlighted by our tool is Kirkstall Road in Leeds, which has high cycling potential and sufficient width for new cycleways. Kirkstall road is already part of plans by Leeds City Council to become a trial cycleway.
Our methods, based on open data and code, could be used in cities worldwide. Given the global nature of the challenges we face, open and collaborative research is vital. The potential for international application can be seen in research we carried out for the World Health Organization on possible cycling uptake in cities in low income countries.
Maps showing existing, disjointed cycleway networks (green), potential cycleway routes on wide roads according to the Rapid Cycleway Prioritisation Tool (blue) and cohesive networks (purple) in 6 major cities.Robin Lovelace
Planning for the future
The UK government has announced £2 billion of investment in measures to promote walking and cycling in England over the next five years. £250 million has been allocated for emergency interventions to make cycling and walking safer.
Similar commitments are being made in Scotland and Wales. Local authorities urgently need to decide how this funding should be spent.
If action is prioritised in places where there is a long-term need for cycle improvements, there is a greater chance that these developments can become permanent. In Paris, COVID-19 related measures aim to contribute towards Mayor Anne Hidalgo’s long-term Plan Vélo.
New cycling infrastructure is more likely to be effective when it is developed based on analysis of the best available data, in combination with vital local knowledge. City planners, politicians and citizens need to act to ensure that transport interventions made during the crisis are of maximum benefit now and in the post-pandemic world.
Reflections on the impact of COVID-19 on grocery shopping
Over the past few months we have all felt the impacts of COVID-19 on our grocery shopping. Be these direct impacts resulting from a government-imposed lockdown, changing of purchasing behaviour to reflect more time spent at home, or adapting to new financial realities. Grocery shopping is something we all need to do.
In the three weeks leading up to the UK lockdown on 22nd March, amidst the chaotic scenes inside supermarkets and in the news, supermarkets took an additional £1Billion per week compared to 2019. These revenues represent small increases in usual weekly household spend on certain products, with product shortages reflecting the ‘just in time’ basis of grocery supply chains where storing reserves of goods is limited.
Government advice to limit time spent outside the home is encouraging a return to the weekly shop. Consumers are making fewer trips for a higher quantity of goods. These trips need to accommodate for more time being spent at home as well as reduced opportunities to shop elsewhere. With the closure of bars and restaurants supermarkets are seeing an increased focus on meal planning.
Front line retail staff have faced the brunt of these changes, accommodating optimised opening hours, social distancing measures and new staffing. New forms of demand segmentation are emerging, based not on traditional measures of loyalty and shopping mission, but to protect the most vulnerable and serve key workers. Government advice to switch to e-shopping is juxtaposed against retailers urging consumers to shop in store to save delivery slots for those who need them most. Despite widespread investment in delivery capacity and staffing (Tesco more than doubling weekly delivery slots to 1.2 million and Sainsbury’s pushing through a 75% increase to more than 600,000 slots), handling the increased demand is a substantial challenge – as anyone who has tried to book a delivery slot lately will have noticed.
Retailers have always needed to balance the need for home delivery coverage against profitability, with most home delivery services operating through the physical store network. Online orders are picked and packed from the shelves of supermarkets rather than through a separate distribution channel. Under normal circumstances, where 13% of the GB population regularly use home delivery services (Hood et al, 2020), this is an effective way to serve consumers and utilise existing supply infrastructure. However, when supermarkets are facing extreme upturns in demand, this system comes under pressure.
Access to home delivery services is not uniform across the country. Capacity is more readily available in areas more likely to have home delivery users under normal circumstances. These services have been built up over a period of time based on sophisticated analysis and location based decision making. My research seeks to address challenges relating to capacity management and home delivery provision. Taking an automated approach to geographic zone design we aim to divide the nation into self-contained areas for home delivery. Taking into account the underlying demand and available capacity, we aim to support the coverage, effectiveness and efficiency of home delivery services.
With online ordering set to continue after lockdown (a forecast 25.5% online growth in 2020), retailers need to adapt to serve a very different target demographic. The geography of e-commerce engagement is the subject of academic research. The CDRC Internet Users Classification shows how online engagement varies across the country. The most vulnerable in society, who are being prioritised for home delivery, will not uniformly live within areas associated with e-commerce usage. Thus retailers are facing a unique challenge in effectively prioritising vulnerable consumers, expanding services and serving a wider range of consumers whilst dealing with increased demand across the network.
Adapted from a University of Leeds, School of Geography Viewpoint piece.
Reflections on the dietary impacts of the COVID-19 lockdown period
The closure of cafés, restaurants and work canteens during lockdown has imposed a significant change on the nation’s eating habits, with many of us now consuming all our meals at home. Time gained back from the daily commute has provided some with the welcome opportunity to reignite a love for home-cooking; my social media feeds have been filled with positive images of people finding pleasure in the wholesome comfort of nourishing the ones they love. But for others, the kitchen is uncomfortable territory and an added pressure at what is already a difficult time.
Undoubtedly, the changes in food availability, tighter purse strings and an increased focus on health have impacted our diets and relationships with food. Anecdotally, we hear of more people growing their own food, reducing food waste and making the effort to support local food suppliers. But exactly how the current situation has affected our diets and nutritional status is the topic of ongoing research, some of which you can contribute to here. My own PhD research explores the utility of supermarket transaction records as a measure of population diet; the primary data collection phase for which started just this week. I therefore have the additional challenge of acknowledging that data for the current period probably isn’t representative of the ‘norm’. But I also have a unique opportunity to contribute to understanding of how the nation’s diets adapted.
For some people, the lockdown has meant a struggle to put food on the table, with lost incomes and missed school meals seeing more families turn to Universal Credit and foodbanks for support. But we’ve also seen a tremendous community spirit, with innovative flexibility from businesses and local volunteers helping to bring food to the most vulnerable members of society.
Others have looked to nutrients as a means to ‘boost’ their immunity. Despite public health advice insisting that taking supplements cannot protect against COVID-19, a friend of mine working for a supplement manufacturer reports that she’s never been busier and is running out of national supplies. Indeed, that many nutrients have a role to play in the normal functioning of the immune response appears to contradict this message, highlighting just how difficult it is to communicate population dietary advice. A recent MyNutriWeb diet and immunity webinar series I attended highlighted the role of the ageing immune system (immunosenescence), and of our gut microflora in interacting with our immune response mechanisms (our guts contain ~70% of our immune cells). Although not exclusive to COVID-19, we may perhaps hypothesise that factors affecting our gut microbiota, may at least go a small way to explain some of the differences in response to the coronavirus that we’ve seen across the population. For example, older adults living in residential care homes have lower gut microbial diversity than those living in community, associated with poorer health outcomes. This may result from reduced dietary diversity and environmental exposures (including surfaces in the outside world and from the kitchen in which food is prepared). But, is it possible that some people’s diets may have actually improved during lockdown? Cooking at home and eating together as a family are both associated with a healthier diet. Increased meal planning has helped many of us reduce food waste, and fewer shopping trips are benefitting the environment too. Not only can home-cooking improve our relationship with food, it is associated with higher fruit and vegetable intake and better nutrient profiles.
For example, around 75% of the salt we consume is already present in the foods we buy, mostly processed foods and those eaten out. So, cooking from scratch gives us the opportunity to take control of our salt intake. Like all nutrients, salt does have an important role to play in our bodies; for regulating fluid balance, enabling nerve transmission and, for muscle contractions. However, consuming too much salt puts us at increased risk of cardiovascular disease, stroke and stomach cancer. Salt’s properties make it extremely useful for the food industry. Firstly, it adds flavour, and not just saltiness; a small amount of salt also enhances our perception of sweetness, without extra sugar. Secondly, it increases the shelf-life of foods by inhibiting bacterial growth. Finally, salt influences the texture of foods by interacting with proteins. While recent food industry reformulation has helped us reduce our salt intake from 9.5g to 8.1g per day between 2003 and 2011, efforts have been poorer in the out of home sector, which isn’t subjected to the same labelling rules as the retail sector. And, as a nation, we’re still eating more than the recommended maximum 6g (1 teaspoon) per day for adults and children over 11 years. But continuing to cook from scratch, replacing salt with herbs and spices, and making our own spice mixes, sauces and marinades can help us to further reduce our salt intake. As we cut down on salt, our tastes also change.
Our food choices and shopping habits are entwined with multiple aspects of social context, including affordability, car ownership, cooking skills, and cultural norms. And so, our ‘food experiences’ of the COVID-19 lockdown period will be vastly different, dependent on our situation, and likely to follow a socioeconomic divide which may indeed serve to widen dietary inequalities.
But just as we’re looking to emerge from lockdown with a more balanced and sustainable outlook on many aspects of our daily lives, whether that’s more flexible working hours, or a continuation of homeworking and the environmental benefits of reduced commuting, there is also potential for a fresh outlook when it comes to diet. What if we could harness the positive resilience that many have shown? What if the ‘dig for victory’ attitude, the community support networks, and the scratch-cooking revolution could indeed become some of the lasting legacies of the hardships of lockdown?
Adapted from a University of Leeds, School of Geography Viewpoint piece released on 1st June 2020.
COVID-19 Reflections: Using data to invent the future cities.
The impacts of Covid19 on our daily lives and habitual routines are undeniable. These changes in our behaviour are reshaping our cities and urban areas; bustling hubs of productivity, creativity and innovation have been rendered temporarily dormant. Leeds is no exception to this, with the city centre experiencing an 89% decrease in footfall compared to the same period in 2019. Briggate is no longer experiencing an influx of Saturday morning shoppers and the once crowded bars on Call Lane are now deserted.
Despite the vast decrease in the footfall within Leeds city centre, it appears that people are still creatures of habit. The current patterns of hourly fluctuations in footfall counts remain similar to pre-pandemic Leeds. There is a rapid increase in footfall until the peak at noon, followed by a slight, gradual decrease in footfall until midnight. Tuesdays still experience the highest level of footfall, and Sundays the lowest. Changes in the night-time activity are evident, with footfall levels close to zero between midnight and 5 am.
Data can provide rich insights into urban dynamics and allow us to understand the complexity of cities. Without quantifying the current conditions of cities, it is challenging to identify how they should be developed and to assess any progress. Pre-pandemic, the deployment of sensors to count pedestrian footfall, measure air quality and quantify noise levels were becoming a popular tool for local councils.
These data remain incredibly valuable, but now there is a drive for cities to utilise data to save lives and improve wellbeing. This can include the use of thermal imaging cameras to detect body temperatures and using drones to identify areas which require better management to allow for social distancing. There are understandable concerns about privacy and data protection. However, now more than ever, it is crucial to demonstrate the use of aggregated data for social good, while protecting individual privacy.
There are many questions as to what our post-pandemic cities will look like, given that the dynamics of everyday life will change. Professor Michael Batty notes the novel opportunity to invent our future cities, rather than to try to predict their complexity. We have the chance to redesign urban spaces with a new future in mind, one in which the health and wellbeing of citizens are at the forefront of urban design. We can use data to ensure future cities cater to the needs of citizens. Local councils and urban planners are already considering the ways urban areas can be ‘future-proofed’ and developed into safe and resilient cities. Plans are varied from pedestrianizing city centres and developing social-distancing friendly green spaces to increasing the role of health departments within urban design.
The future of cities may be uncertain for now. However, this pandemic has provoked discussion around what we want our cities to look like and how to redesign them.
Adapted from a University of Leeds, School of Geography Viewpoint piece
What can tweets about contact tracing apps tell us about attitudes towards data sharing for public health? (Part 2)
In my last blog post I wrote about the importance of understanding attitudes towards data-sharing for public health and its link to my work with the LifeInfo Project. I also advocated that, by analysing Twitter conversations about using contact tracing apps to manage the spread of Covid-19, we could uncover some of people’s underlying thoughts, fears, and hopes about personal data sharing for better health.
Analysis showed many to have taken to Twitter to share their thoughts, particularly sparked by the introduction of the Australian ‘COVIDSafe app’ and the Isle of Wight trial for the UK ‘NHS track and trace app’. In this blog, I will focus on the textual content of these tweets, using Natural Language Processing (NLP) and topic modelling, and discuss how this relates to opinions of data-sharing in the time of Covid-19.
Hot Topics – what do tweets say?
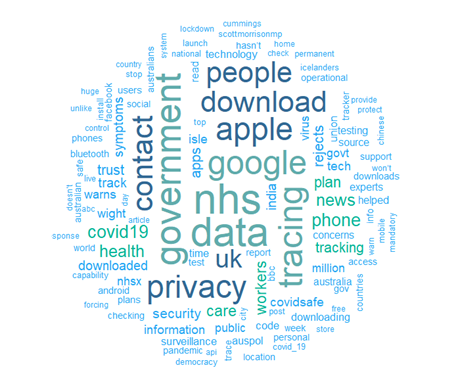
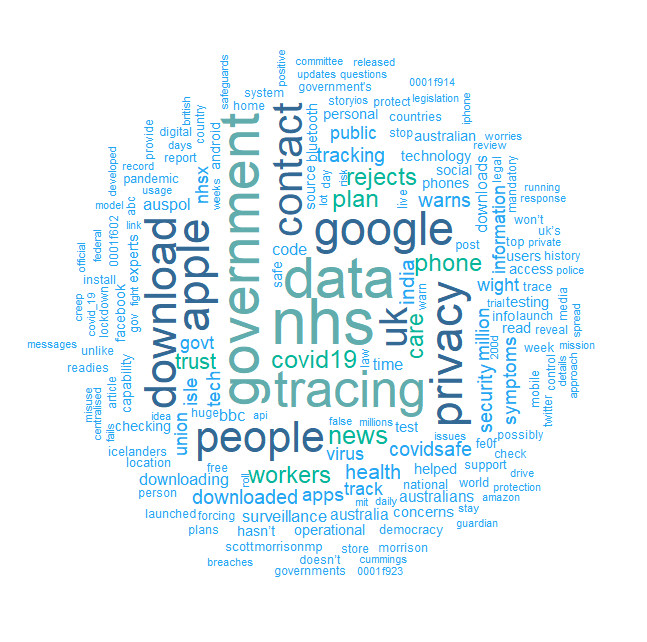
Continued tweet scraping means 18,170 tweets have now been collected on the topic of Covid-19 apps, between 24th April and 1st June 2020. As seen in my last blog, the most frequently used words in these tweets indicates that the conversation has been shaped around particular contexts. Nationalities and geographies are prominent – ‘Isle [of] Wight’, ‘Australian’, ‘UK’, ‘India’, ‘Icelanders’ – as are technological and state actors – ‘government’, ‘NHS’, ‘apple’, ‘google’. This introduces the idea that the wider conversation about Covid-19 apps is made up of smaller topic clusters about different places, specific apps, and associated news stories.
Holly Clarke
Leeds Institute for Data Analytics
Holly Clarke is an Intern at Leeds Institute for Data Analytics, applying data science solutions to solve complex, real-world challenges. She is working for the LifeInfo project with Michelle Morris, researching attitudes towards novel lifestyle and health data linkages and how access to this information could improve public health.
Topic Modelling is a technique often used to uncover latent topics within a set of documents (in this case tweets about Covid-19 apps) through statistical analysis of semantic similarities. The Latent Dirichlet Allocation (LDA) algorithm is built on the principle that each document is made up of small number of topics, and each topic is identifiable by its use of words.
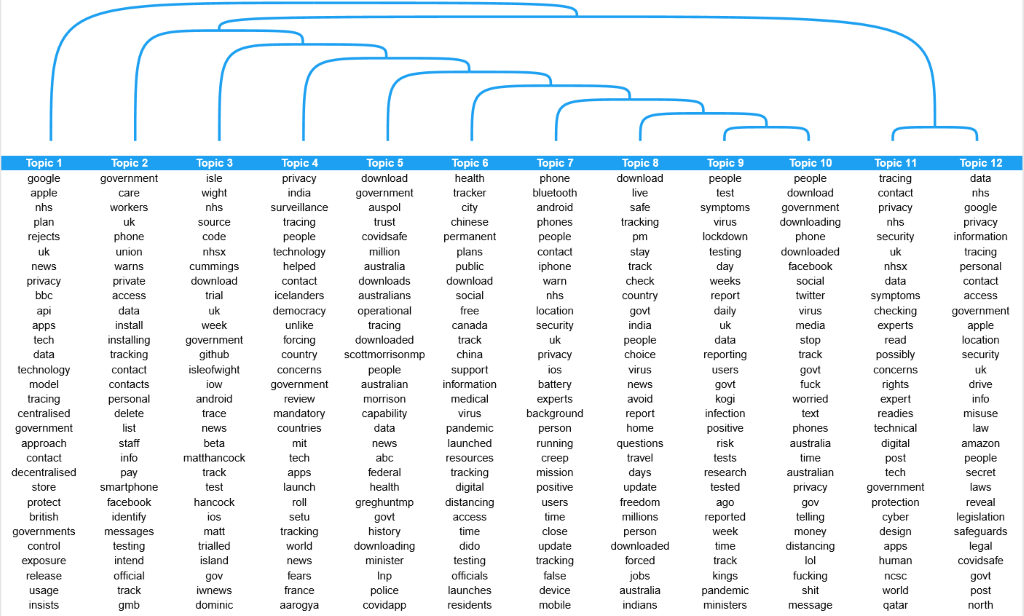
This algorithm was employed to uncover 12 topics within the Twitter conversation about Covid-19 apps, as displayed in Figure 1. A data-driven approach was used to identify the number of topics, taking the model with greatest probabilistic coherence across topics1. Table 1 has a full breakdown of topic interpretations with the words most associated with each topic displayed in Figure 1.
Topics, however, need to be interpreted. Some consist of a finer granularity of related content, for example, Topic 9 focuses on symptom tracking apps, predominantly in the UK context but also in Kogi State, Nigeria. Other topics are modelled as separate but found to be lexically similar through hierarchical clustering. This is displayed by the dendrogram at the top of Figure 1, indicating how closely related the twelve topics are to each other2. For example, Topics 11 and 12 both focus on rights, and concerns about the security and privacy of coronavirus apps. Yet, the former takes a more technological perspective, using words like ‘cyber’, ‘tech’ and ‘digital’, while the latter uses more legal jargon – ‘legislation’, ‘laws’ ‘legal’.
Figure 1: Topics within tweets about Covid-19 apps and the top 30 words associated with each topic according to their phi value (bottom), dendrogram indicating how lexically similar topics are to each other according to hierarchical clustering (top).
Table 1 showing the interpretations of each topic, found through topic modelling, developed through examination of topic‘top words’ and taking examples from original tweets3
TOPIC
INTERPRETATION OF TOPIC
1:
UK’s decision to develop a centralised app over the Google/Apple decentralised system.
Track and Trace app trialled on the Isle of White. Links with Dominic Cummings (Government Advisor).
4:
Topics of privacy, force, democracy and surveillance relating to Indian ‘Aarogya Setu app’. ‘Icelanders’ appears, perhaps because Iceland was also an early adopter of a contact tracing app.
5:
Australians downloading COVIDsafe app. Political, with direct references to Scott Morrison (PM) and Greg Hunt (health secretary), ‘LNP’ (Liberal National Party), ‘police’ and ‘auspol’ (Australian politics hashtag).
6:
Several threads of news stories within this cluster; Chinese city plans to transform Corona app into a permanent health tracker, people using a symptom tracker app in Canada, ‘Dido’ in relation to Dido Harding (ex-director of TalkTalk)’s involvement in NHS app.
7:
Technological issues with contact tracing apps – Bluetooth, battery, background data, Android, Apple. Also, privacy, surveillance and ‘mission creep’ concerns with NHS app.
8:
Broad topic with themes of safety – ‘stay’, ‘safe’, ‘home’ and mobility ‘freedom’, ‘travel’.
9:
Covid-19 Symptom Tracking app UK (Zoe) and research from King’s College with these data. Similar Kogi State (Nigeria) symptom self-assessment app.
10:
Parallels drawn between data collection by contact tracing apps and other social media platforms, negative words and expletives used, often in relation to irony, people rejecting apps due to privacy concerns but using Facebook etc.
11:
Personal rights and privacy/security concerns about coronavirus apps, from technological perspective ‘experts’ ‘technological’, ‘cyber’
12:
Personal rights and privacy/security concerns about coronavirus apps, from a legal perspective – ‘misuse’, ‘access’, ‘laws’ ‘legislation’.
Overall, topic modelling conveys several things about Covid-19 app attitudes. First, as hypothesised, conversations are strongly shaped around context, detailing prominent news stories and events, but this also influences how apps are talked about. Topic 4 includes references to issues of ‘privacy’, ‘surveillance’, ‘democracy’ and ‘force’ when talking about the Indian ‘aarogya setu app’ which is mandatory for government employees. Topics 1 and 7 have more of a technological and practical focus within the UK context, although still in relation to personal privacy, discussing centralised/decentralised apps, Bluetooth and battery issues.
Second, although contact tracing apps are the predominant focus, topic modelling distinguishes other Covid-19 apps sharing different kinds of data. Topic 1 focuses on symptom trackers and Topic 2 the ‘Care Workforce app’ to disseminate information.
Third, most topics report events rather than represent attitudes or positions, although many do contain negative words such as ‘concern’, ‘warn’ or ‘worries’. Topic 10, however, stands out by including expletives – indicating anger is evident within this part of the conversation.
All these topics make up a significant portion of the total tweets, ranging from 6.6% for Topic 2 to 10.6% for Topic 10, conveying that no single topic dominates.
COVIDSafe vs Track&Trace: Actors Matter
Alongside creating a dataset of tweets about Covid-19 apps I have also been collecting tweets about specific apps – the Australian ‘COVIDSafe app’, and the ‘NHS Covid-19 app’/‘Track&Trace app’, in the UK. My aim was to compare attitudes towards these apps and expose potential commonalities and differences between issues such as personal privacy, surveillance and data security, and link this to policies and practices. The overwhelming interpretation of this analysis, however, is that actors matter.
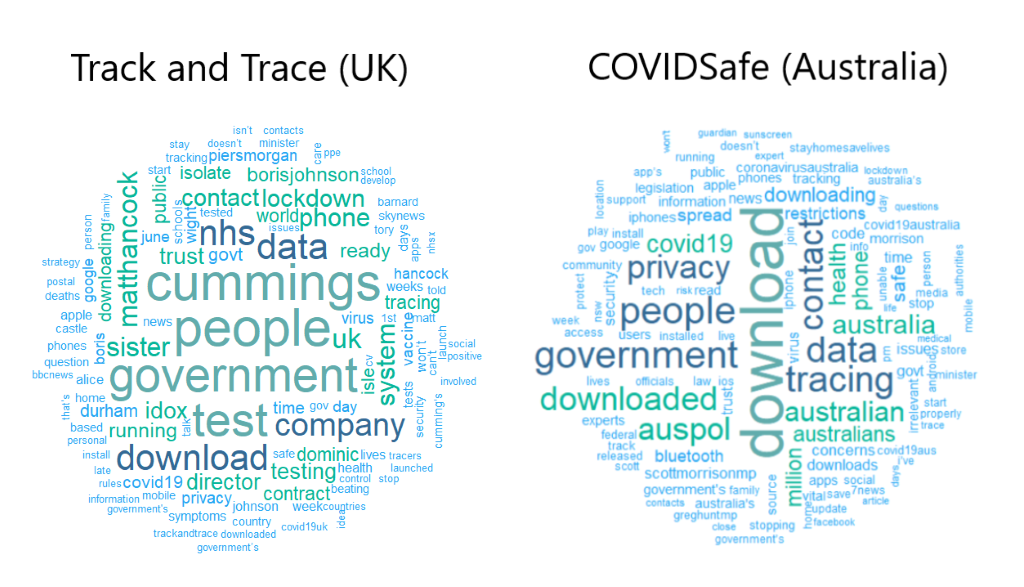
Figure 2: Word clouds of most-frequent words included with tweets about the ‘Track and Trace app’ (UK) and the ‘COVIDSafe app’ (Australia).4
The word ‘government’ appears prominently in both the COVIDSafe (Australia) and Track&Trace (UK) wordcloud as one of the most frequently used terms, showing the centrality of the state to conversations about contact tracing apps. Relatively high levels of trust in governments to use data appropriately means they may be in an advantageous position to convince people to share their personal data to help track and quell the spread of coronavirus. It is also possible that the ‘NHS’ branding of the UKs app could influence people to support and use it due to high levels of trust in this organisation.
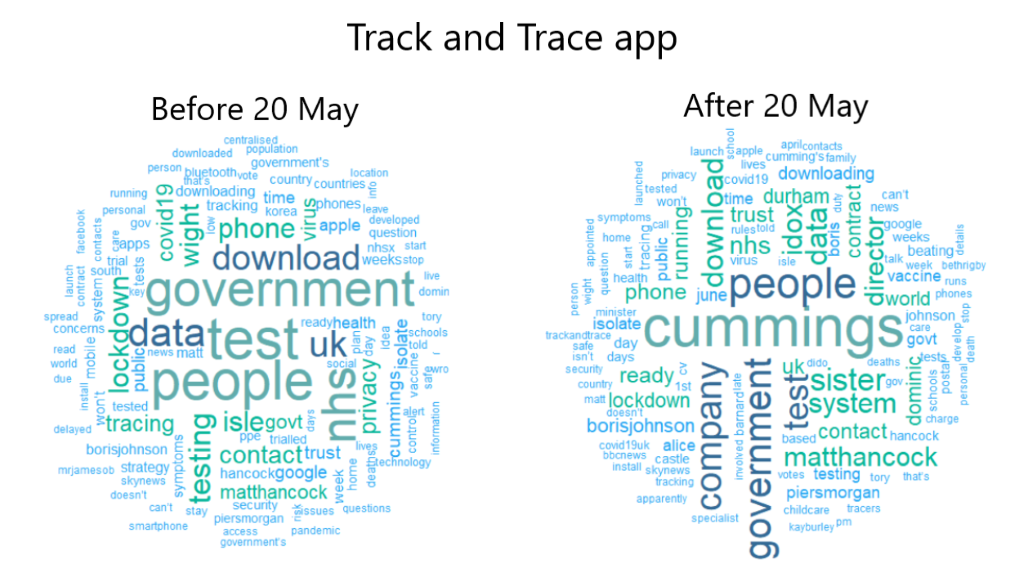
It would be remiss not to mention, however, the frequent references in the UK data to Dominic Cummings, the government chief advisor who during the time period of tweet collection has been scrutinised due to his journey to Durham during lockdown. Many frequently used words reference a rumour that his sister is involved with the contact tracing app – ‘Idox’, ‘sister’, ‘director’, ‘contract’, ‘Alice’. Although this has been found to be untrue by the fact checking organisation FullFact, this association could undermine public trust and creates confusion about who has access to data collected from the app.
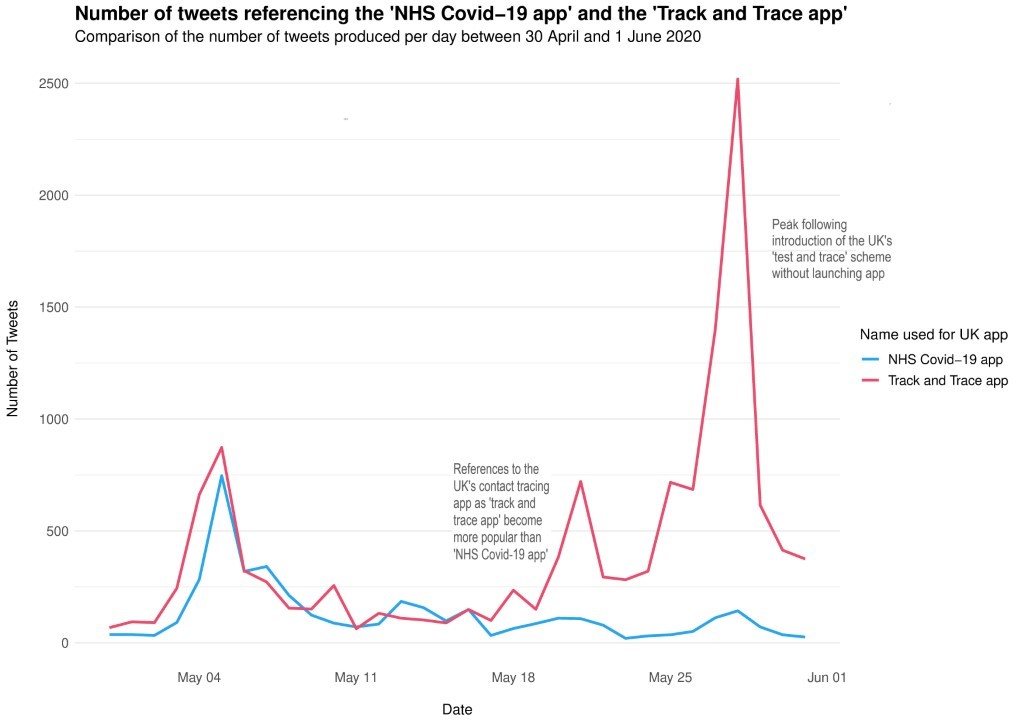
Figure 3: Comparison of the number of tweets produced per day referencing the ‘NHS Covid-19 app’ and the ‘Track and Trace app’ (separate names for the UK app) between 30 April and 1 June 2020. Figure 4: Word clouds of most-frequent words included with tweets about the ‘Track and Trace app’ (UK) between 29 April 2020 and 20 May 2020 (left) and 21 May to 1 June 2020 (right).4
As is shown in Figure 3, tweets containing reference to a ‘NHS Covid-19 app’5 (the official naming of the UK’s app) are in line with tweets about a ‘Track and Trace app’ until mid-May. Past this point tweets about the NHS app are eclipsed by those about ‘Track and Trace’, showing the diminishment of the NHS branding at this point. At the same time, tweets about the ‘Track and Trace app’ contain fewer references to the ‘NHS’ and ‘government’ and greater references to ‘cummings’ (Figure 4). This seems indicative of a shift in the public mind away from the app as a neutral, technological, health tool towards something more political.
Comparatively, while references to Scott Morrison (PM) and Greg Hunt (Health Minister) are evident within the Australian dataset, the conversation seems to focus on the government as a unified actor. The UK have not announced a date for the track and trace app to be released nationally, but given downloads have fallen short of targets in Australia, it seems unlikely mass support will be mobilised here.
In my next blog post I will be looking at what sentiment analysis on tweets can tell us about people’s attitudes to contact tracing apps, follow up with any current developments, and round off this blog series with a discussion of how the Covid-19 pandemic might impact data-sharing practices and attitudes going forward and what this could mean from projects like LifeInfo.
1 10 models were created with topics ranging from 1-101 in intervals of ten to estimate an optimal ‘topic window’ where topics were found to have the greatest probabilistic coherence. A further 20 models were then created within this window (11-31 topics) to select the model with the highest overall topic coherence.
2 Closeness of topic found through hierarchical clustering using the Hellinger Distance for phi – (P(token|topic))
3Top words found by the highest phi values per topic, where phi is P(word|topic)
4 common ‘stop words’ are excluded, for example ‘is’ or ‘and’, also the words directly related to the search terms for the app e.g. ‘covidsafe’ , ‘track’ or ‘app’.
5 Inclusive of any reference to NHS ‘corona’ or ‘covid’ app.
What can tweets about contact tracing apps tell us about attitudes towards data sharing for public health? (Part 1)
The ongoing COVID-19 pandemic means governments have been looking for technological solutions in order to reduce the spread of the virus. Contact-tracing apps are now being used, from Singapore’s ‘TraceTogether’ to ‘StopKorona!’ in North Macedonia. As restrictions on movement are eased in many countries, these apps aim to identify if an individual has been in contact with an infected person through Bluetooth and/or GPS signals. This provides alerts to users and creates early warnings of new outbreaks. As these apps have been adopted, a huge amount of online discussion has followed about the benefits and concerns around sharing personal data for the benefit of public health.
So much of this conversation seems novel. Several months ago, most in the UK would have gawked at the possibility of a government app privy to information about who they come into contact with. Yet, the phrase “we are in unprecedented times” has been difficult to escape in recent weeks.
For me, the onset of the pandemic has coincided with a new research position with the LifeInfo project, under the supervision of Michelle Morris‘ expertise in Health Analytics. This project focuses on people’s attitudes towards sharing their lifestyle data – from supermarket loyalty card to fitness apps – and linking this to health records to drive research into the risk factors of non-communicable diseases such as diabetes, heart disease and certain cancers. Access to these data could have immense benefit as millions of yearly deaths can be attributed to poor diet and physical inactivity.
Holly Clarke
Leeds Institute for Data Analytics
Holly Clarke is an Intern at Leeds Institute for Data Analytics, applying data science solutions to solve complex, real-world challenges. She is working for the LifeInfo project with Michelle Morris, researching attitudes towards novel lifestyle and health data linkages and how access to this information could improve public health.
At the heart of this project is also the vital recognition that we must understand people’s concerns about such initiatives and adapt research accordingly. Part of my role is analysing free-text survey responses about the circumstances under which people would share different types of lifestyle data for health research and factors that might impact their decision to do so. While the conversation about contact tracing apps and their place in our lives is certainly novel, many of the words and topics about these apps mimic those that come out of my analysis.
This made me wonder how I could tap into the conversation about contact tracing apps and the insights this could give about data sharing, privacy, surveillance and public health. For the past two weeks I have been scraping tweets about coronavirus apps and will continue to do so as they are developed, trialed, and used in countries around the world.
This is the first of a series of short blog posts about attitudes towards contact tracing apps and data-sharing for public health. Using text analysis and Natural Language Processing (NLP), I will be answering questions about the conversation around these apps. What topics are prevalent and how do people feel about sharing their data? How does this look in different countries and what role does context play? How does this relate to more general attitudes about data-sharing for public health benefit and what might the impacts be going forward? Twitter is by no means a direct expression of public opinion, but analysing tweets can give us important insights about people’s attitudes, news stories that shape narratives, and shifts in opinion over time.
So, are people talking about contact tracing apps?
The first thing to establish is whether people actually care about contact tracing apps. Here, the answer is an undeniable “yes!”. A total of 12,593 tweets were collected on the topic of COVID-19 apps produced during the two-and-a-half-week period between 24 April 2020 and 12 May 2020 (and limiting collection to those in the English language)1. Governments need around 60% of the population (80% of UK Smartphone users) to enable contact tracing apps for them to be effective, which could influence many people to consider their relationship with data-sharing that haven’t given much thought to it before.
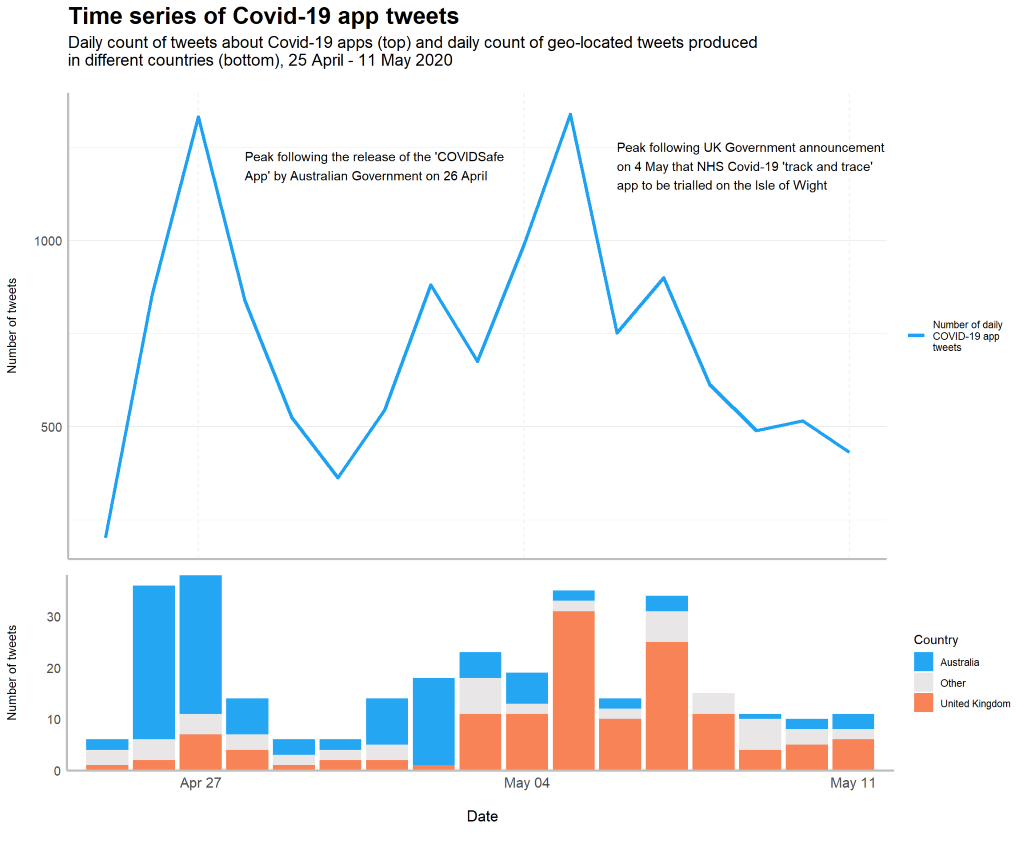
Tweets about coronavirus apps have gone from relatively low numbers (just 203 tweets on 25 April, the first full day of collection) to peaks of over 1300 tweets per day on the 27 April and 5 May. These peaks can be linked to the ‘COVIDSafe’ app release in Australia and the announcement that the NHS ‘track and trace’ app was to be trialed on the Isle of Wight in the UK (see figure 1a).
Figure 1: Time Series of Covid-19 app tweets showing (a) the number of tweets about Covid-19 apps per day (top) and (b) the number of geo-coded tweets that were produced in different countries highlighting Australia and the UK (bottom), 25 April –11 May 2020.
Where are people talking about COVID-19 apps?
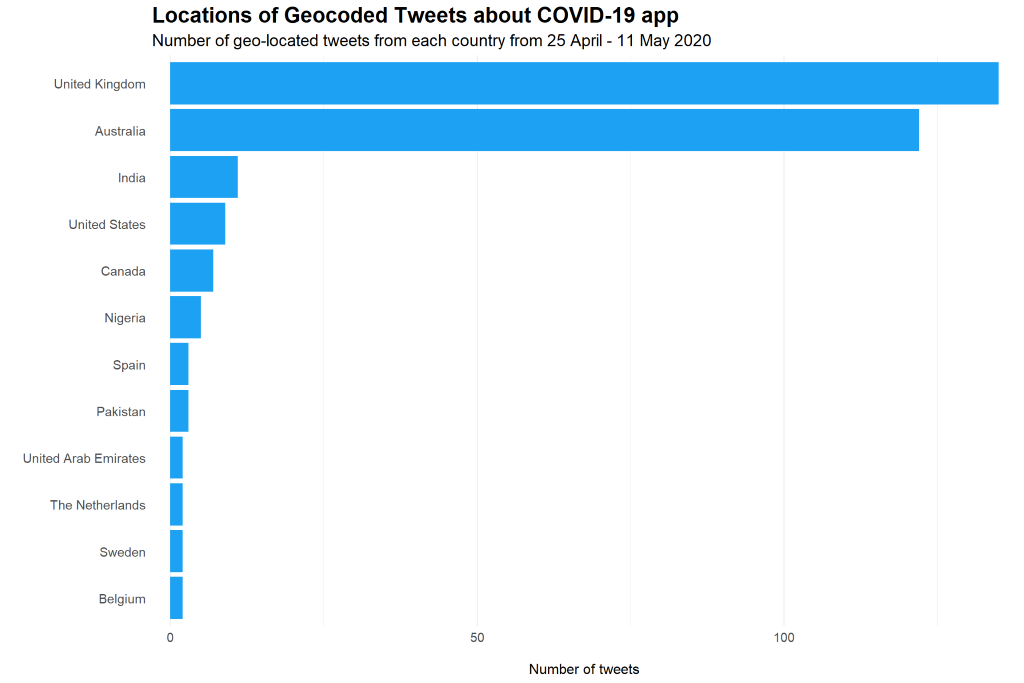
Some tweets are geo-located, indicating the country and even city the tweets were produced. Although these tweets make up only a small proportion (2.5%) of the total tweets collected, they act as a sample to indicate where people were tweeting about COVID-19 apps.
Figure 2: Locations of geo-located tweets about Covid-19 apps showing (a) the number of tweets collected from each country (top) and (b) their locations on the world map (bottom), 25 April –11 May 2020.
Most tweets are shown to be produced in the UK and Australia. In these countries contact tracing apps have been nationally introduced and promoted (in the case of Australia) or locally trialed (in the case of the UK). Canada and the US currently constitute only a small proportion of tweet locations; however, this could change in the forthcoming weeks as these countries are yet to announce apps.
India is the third most popular country for tweet locations where the contact tracing app ‘Aarogya Setu’ has been introduced with associated controversies about personal privacy. Many more tweets about this app have likely been created but in languages other than English, so are not included within the dataset. This is important to consider as insights gained from analysing tweets will reflect a majority Western perspective. Some of the first countries to introduce contact-tracing apps are non-English speaking (for example South Korea) and additionally have restriction on access to Twitter (in the case of China).
Over 80% of the geo-located tweets were produced in two countries – the UK and Australia. Yet, this is not consistent across time. As shown in figure 1b, during the first week of data collection the conversation was dominated by the Australian context (shown in blue), and this is consistent with the first peak of tweets related to the roll-out of the Australian contact tracing app. Following this, the second week of data collection shows the conversation has shifted towards the UK context (shown in orange) as the NHS app is trialed in the Isle of Wight.
What do tweets say?
Next week’s blog post will focus what people are saying about Covid-19 apps, whether attitudes are positive or negative, and if this differs based on the country and context. The wordcloud below gives an initial insight into the current conversation around these apps. Two findings stand out. First, context appears to play a large role in shaping the conversation. Words referring to key places and actors (both technological and state) are frequently included in tweets. These include ‘government’, ‘nhs’, ‘apple’, ‘google’, ‘India’, ‘Australia’ and ‘Isle [of] Wight’. Second, it is striking that the words ‘privacy’ and ‘trust’ are amongst the most frequent words used, showing data management and personal privacy to be at the forefront of discussion.
Figure 3: Word cloud of most-frequent words included with Covid-19 app tweets2
1Search terms included any reference to ‘corona/coronavirus/covid/covid-19 app’ as a single phrase and inclusive of alternative punctuation and spacing
2Note: common ‘stop words’ are excluded, for example ‘is’ or ‘and’, also the words ‘corona’, ‘covid’ and ‘app’ are excluded as these were the search terms and thus highly frequent.
CDRC to adopt key role in powerful new COVID-19 data alliance
The Consumer Data Research Centre will work through its parent organisation Leeds Institute for Data Analytics to provide a new COVID-19 data alliance with scientific expertise and access to global academic research networks.
Leeds Institute for Data Analytics (LIDA) has worked alongside consortium-leader Rolls-Royce to develop the concept and will take a founding position in a new alliance of data analytics experts challenged with finding new, faster ways of supporting the response to COVID-19 and subsequent global recovery.
Together the initial wave of members brings all the key elements of open innovation; data publication, licensing, privacy, security; data analytics capability; and collaborative infrastructure, to kick off its early work and grow its membership.
Emergent will combine traditional economic, business, travel and retail data sets with behaviour and sentiment data, to provide new insights into – and practical applications to support – the global recovery from COVID-19. This work will be done with a sharp focus on privacy and security, using industry best practices for data sharing and robust governance.
As part of LIDA’s involvement in Emergent, researchers will have the opportunity to access these data sets using collaborative platforms which have been established by CDRC. The academic community will be encouraged to articulate and engage in projects to help understand the changes we are seeing in human activity and social behaviour as a result of COVID-19.
Emergent models will help get people and businesses back to work as soon as possible by identifying lead indicators of economic recovery cycles. Businesses small and large around the world, as well as governments, can use these insights to build the confidence they need to take early decisions, such as investments or policies, that could shorten or limit the recessionary impacts from the pandemic.
The alliance is voluntary and insights will be published for free.
Professor Mark Birkin, who leads both the Consumer Data Research Centre and Leeds Institute for Data Analytics commented:
“Increasing numbers of academics and other commentators are now recognising the potential for commercial organisations to share important data to help in the battle against COVID-19.
An established investment in data sharing capability and analytics capacity makes LIDA ideally placed to lead such conversations.
We are delighted to bring our skills and expertise as a founder member in the Emergent consortium, which offers such enormous potential to deliver benefits to society – and which are so badly needed at this difficult time.”
Connecting business and the academic community
The Consumer Data Research Centre was created in 2014 from a substantial award in the ESRC Big Data Network. Leeds Institute for Data Analytics at the University of Leeds was then established from the union of the CDRC (Leeds) with the MRC Centre for Medical Bioinformatics.
Since then, both LIDA and the CDRC have been actively promoting the mutual benefit of collaborative projects between corporate partners and the academic community, with researchers working in cross industry teams to undertake scientific research that produces real world insights.
The COVID crisis has further highlighted the importance of these types of collaboration, with governments and their advisers seeking real world insights into mobility, behaviour and human contact networks.
LIDA and IBM will be providing the infrastructure to enable alliance partners to share and compute their data.
Where there is a need to use secure data, partners will be granted access to LIDA’s ISO accredited infrastructure, which will enable them to perform analysis in a safe and controlled environment. Partners using the LIDA infrastructure will be supported by project management and technical support teams from the Consumer Data Research Centre.
For projects using public data, partners will use IBM’s environment and any non-sensitive data will be shared via emergentalliance.org.
Join Emergent
Caroline Gorski, Global Director, R2 Data Labs, the Rolls-Royce data innovation catalyst which started the alliance, said: “We want the global economy to get better as soon as possible so people can get back to work. Our data innovation community can help do this and is at its best when it comes together for the common good.
“People, businesses and governments around the world have changed the way they spend, move, communicate and travel because of COVID-19 and we can use that insight, along with other data, to provide the basis for identifying what new insights and trends may emerge that signify the world’s adjustment to a ‘new normal’ after the pandemic.”
The first challenges have already been issued by the alliance, including one to identify lead indicators of economic recovery which businesses can use to build the confidence they need for investment or activities that will shorten or limit any recessionary impact from the virus.
Emergent hopes to rapidly expand its network of data owners and has set up a website for potential members to register their interest at emergentalliance.org.
CDRC (Leeds) also encourages prospective academic participants to contact us directly at [email protected] to receive further updates.
Scientists have for the first time used anonymous data from pre-payment food cards to get a unique insight into the eating habits of first year university students.
Data scientists from the Consumer Data Research Centre at the University of Leeds have been able to build a detailed picture of what 835 students ate, and when, by analysing the data linked to their pre-payment food cards.
The cards revealed what they were buying in the campus refectory and associated food outlets.
The analysis gives the most accurate picture to date of first year student diets. Many previous studies have used food diaries, but their accuracy can be variable because they rely on the student remembering exactly – and being honest about – what they have eaten.
Dr Michelle Morris, a University Academic Fellow in Health Data Analytics based at Leeds Institute for Data Analytics, said understanding student diet had public health implications.
Previous studies in the UK and the US have shown that “fresher” students are at risk of weight gain, probably as a result of the lifestyle changes that come with starting university.
In the US, they talk of the “Freshmen 15”, the 15lbs (6.8kg) that students put on. In the UK, research indicates the average student gains 7.7lbs (3.5kg).
The study, which pre-dated the coronavirus outbreak and followed the students aged 18 to 24 over their first semester (12 teaching weeks), revealed student eating habits which clustered around seven dietary behaviours:
Vegetarian: with popular purchases being salads, breakfast cereals, yoghurt and fromage frais and a notable absence of meat products
Omnivores: which included the most average amounts of all products purchased, with above average amounts of ice cream, desserts and cakes, breakfast cereals and fish.
Dieters: with above average purchases of soups, pasta, noodles and salad.
Dish of the Day: which included above average purchases of meat and meat products.
Grab and Go: which included above average purchases of sandwiches, crisps, nuts and eggs.
Carb Lovers: with bread, cheese, egg products and pasta being among the top picks.
Snackers: with confectionery, crisps, nuts being above average choices.
Dr Morris, said the dietary patterns were ranked on the basis of “healthfulness”, with vegetarian the most healthful and snackers being the least.
She added: “Our analysis shows that although some students followed one dietary pattern throughout the semester many switched between them.
“Some students moved from a more healthy to a less healthy pattern; for example, some vegetarians switched to an omnivore diet; and vice versa with some of the students who started off as snackers – the least healthful diet – did move to the Dish of the Day which offered a more balanced range of food options.
“Worryingly perhaps, the most popular move was from a dieter pattern, to the snacking pattern.”
Females were found to be heavily represented among the vegetarians (88%) and dieters (80%) while the men dominated the dish of the day (84%) and grab and go (62%) diet patterns.
“This information could be used to target information about healthier eating to students.” Dr Michelle Morris, Leeds Institute for Data Analytics
Dr Morris said the most popular dietary pattern amongst the slightly older students, those aged between 20 and 24, was the omnivore pattern of eating – that could be due to the fact that they may already have lived away from home and settled into a more varied dietary pattern.
She said: “The information from this analysis reveals the pattern of the students’ eating habits, and how that changes over time. That is information that could be used to target information about healthier eating to students.
“Research has shown that adult eating habits take root early in adulthood. So, time spent at University is a great time to encourage healthy eating behaviours that could remain with them for life.”
The research was funded by the Economic and Social Research Council through a Strategic Network for Obesity grant. Maintaining the anonymity of the students was of utmost importance at all stages of the research.
Notes to editor
For further information or interview requests, please contact University of Leeds Media Relations and Communications Officer David Lewis via [email protected]
Work has been transformed by the coronavirus crisis with remote working now the norm for millions of workers. But distance from the office is also providing some opportunities to take a wider perspective of the data landscape and to scan business horizons using data sources that we might have overlooked or never investigated in detail.
The CDRC Data Store remains open for business, and our Open and Safeguarded data products are available as normal. Our Secure labs are closed for the duration of the crisis, but we are still accepting Secure data applications for access when things return to normal.
For students, our Masters Dissertation Scheme is still running with a record number of projects for students to complete in the coming months using business and CDRC data. The scheme gives Masters students registered at any UK university a unique opportunity to engage with horizon scanning or other business problems using novel datasets and interesting business perspectives on applied problem-solving. In the past, many participating students have carried out work at the businesses office, but this year students are being offered opportunities to work with businesses through homeworking for the duration of the crisis. The Scheme still brings together the best of academic and business perspectives upon applied problem-solving. Academic supervisors similarly gain the opportunity to collaborate on potentially high impact research with the business community.
So… if you are a Master’s student interested in collaborating with business, but can no longer do this through fieldwork or primary data collection, why not click here to see if any of the CDRC projects interest you? A number of the organisations that we work with are very keen to use part of their homeworking to coach students in the workings of business, especially if you have relevant skills and ways of working to offer!
We also have the CDRC Data Store which has a wide range of data sets available, some of which may be very useful in your dissertation or current research.
Populations who frequently eat fast food and live within close proximity of unhygienic food establishments may be at higher risk of contracting foodborne illness than those who do not eat takeaways regularly – but which food establishments are most likely to be unhygienic?
Recent research by CDRC PhD student Rachel Oldroyd uses logistic regression to identify ecological determinants of non-compliant food outlets in England and Wales. Rachel’s recent paper in Health & Place highlighted:
A clear gradient of association is observed between increased deprivation and the probability of non-compliance.
Food outlets in the most deprived areas are 25% less likely (OR = 0.75) to meet hygiene standards than those in the least deprived areas.
Takeaways, sandwich shops (OR = 0.504) and small convenience retailers (OR = 0.905) are less likely to be compliant than restaurants.
Food outlets in large conurbation areas are less likely (OR = 0.678) to meet hygiene standards than those located in cities and towns.
Outlets in deprived and urban areas, especially takeaways, sandwich shops and convenience stores should be prioritised for inspection.