

The census provides an extensive snapshot of society, and it is utilised by the government and local authorities to inform policy and resource allocation. However, it is difficult to utilise this resource without prior experience in data manipulation and analysis.
Project overview
This project aimed to provide access to Leeds census data for a range of end-users in the form of a data dashboard. The Intelligence & Policy Team at Leeds City Council (LCC) receives a substantial number of census-related data requests from councillors, different departments, and members of the public. The process of downloading, manipulating, and analysing census data can be time-consuming and tedious. This dashboard aimed to minimise the time spent on this process, providing insights at the click of a button.
Data and methods
Census data that is open-access and meets statistical disclosure control (SDC) limits, can be used in different combinations. For this project, census data were downloaded from the Office for National Statistics (ONS) or Nomis (National Online Manpower Information System) websites. Data were downloaded for both the 2011 and 2021 Censuses, and at the Ward and Lower Layer Super Output Area (LSOA) scales. The spatial boundary data (ESRI Shapefiles) were provided by LCC but can also be accessed online. This was converted into TopoJSON files, and their coordinate reference systems (CRS) changed in a free online resource, ‘Mapshaper’. These spatial transformations were necessary because the software chosen to host the dashboard, Microsoft PowerBI, requires files to be in this format and with a specific CRS (EPSG: 4326).
Data wrangling took place in the Power Query Editor (PQE) in PowerBI. The census data were downloaded in CSV format and read into PowerBI. In the PQE, steps such as removing unnecessary columns, editing column headers, and merging data, could take place, allowing the appropriate format required for the PowerBI dashboard. In the Data Model, connections were formed between variables (columns) that allowed the visuals to interact with each other in the dashboard.
The theme/style of the dashboard were kept consistent across the pages. The colour scheme, map shape, slider and some buttons appear in the same position on every page. The visuals ranged between Clustered and Stacked Bar Charts, Shape Maps, Doughnut Charts and Tornado Charts (Downloaded Visual). Some of the visuals interact with each other on the page, and by selecting an area or multiple areas on the map (Ward or LSOA) the local statistics are displayed on the page. Some visuals (which are specified) can be clicked to return a choropleth map. DAX equations have been implemented on some graphics, demonstrating the percentage (%) change between 2011 and 2021 across categories of a variable and spatial scale. Other graphics have tooltips (pop ups) which provide further information such as totals and proportions (%).
In the dashboard users can also click between 2011 and 2021, Ward and LSOA data. There are links to download the data and access the Leeds Observatory on all pages. Tutorial, contents, information, and quick links pages are also available in the dashboard allowing users to access further information and help if they require.
The dashboard will initially be published on the Leeds Observatory and Consumer Data Research Centre (CDRC) websites, allowing for public access. The dashboard will also be published by Leeds City Council at a later date.
Key findings
This census data dashboard tool will allow a range of end users to access census data at the click of a button, which will save significant resources.
Accessibility was a significant consideration in the design of the dashboard, and we believe we have achieved this. Clear guides on how to navigate through the dashboard and help pages will aid users’ ability to use the tool (See Figure 1 for an example).
This project has demonstrated that using Microsoft PowerBI software is an effective way to produce a general-purpose dashboard for Leeds census data. Through user-testing it has been found that the dashboard is easy to use and understand for a range of end-users. Leeds City Council have begun to use this tool and it has proved effective for what they wanted to achieve. There are many potential uses of the dashboard, so it is promising that initial findings suggest it is working successfully.
We have been successful in implementing all the topics that were set out at the start of the project, at two different spatial scales, and over two iterations of the census (See Figure 2 for an example). We also have gone beyond the initial scope of the project, by implementing DAX measures (allowing comparisons between the 2011 and 2021 censuses). However, implementing complex cross-tabulations (combining multiple variables) were beyond the scope of this project and future research into the ability to implement these in PowerBI could be useful.
Value of the research
This tool will benefit a range of end-users who utilise census data for Leeds. It will allow the Intelligence & Policy Team to respond to census related requests efficiently. Moreover, it is hoped that as awareness of the tool grows in the council, many queries will be answered without the requirement to contact the team.
It can be used by the public to discover statistics for their area, and spark curiosity in census data. The dashboard would be suitable for use within schools, higher education, and industry. It is important that dashboard tools exist, so access is not limited to those with backgrounds in data, so that people can ask questions about their local area.
This tool will provide a snapshot of society to Councillors and Leeds City Council officials, thereby supporting local policy making and neighbourhood resource allocation.
Quote from project partner
“The Census is a vital tool in helping us to better understand our city and the people who live and work here. The depth of insight at the touch of a button this project has enabled us to access will change the game in supporting more people to access meaningful data in a user-friendly way. In addition, the results from the project will assist us through informing strategic conversations with councillors, helping to guide our work on equality diversity and inclusion, and generating further lines of enquiry more quickly than we’ve been able to previously.”
Mike Eakins – Head of Policy, Leeds City Council
Insights
• This census dashboard is user-friendly and accessible.
• It will benefit a range of end-users, from councillors to the public.
• Microsoft PowerBI is an effective method of presenting Leeds census data.
Research themes
- Health
- Societies
- Environment
Programme themes
- Statistical Data Science
- Data Science Infrastructures
People
Owen Hibbert – Data Scientist, Leeds Institute for Data Analytics, University of Leeds
Rachel Oldroyd – Lecturer in Geographic Data Science, University of Leeds
Myles Gould – Associate Professor, School of Geography, University of Leeds
Nik Lomax – Professor of Population Geography, University of Leeds
Richard Haslett – Intelligence & Policy Officer, Leeds City Council
Mike Eakins – Head of Policy, Leeds City Council
Claire Keightley – Intelligence & Policy Manager, Leeds City Council
Partners
Leeds City Council
Funders
This project was funded by the Consumer Data Research Centre (CDRC), an ESRC Data Investment. Funding references ES/L011840/1; ES/L011891/1. The Census Dashboard was developed by the CDRC at the University of Leeds in collaboration with Leeds City Council.
Images
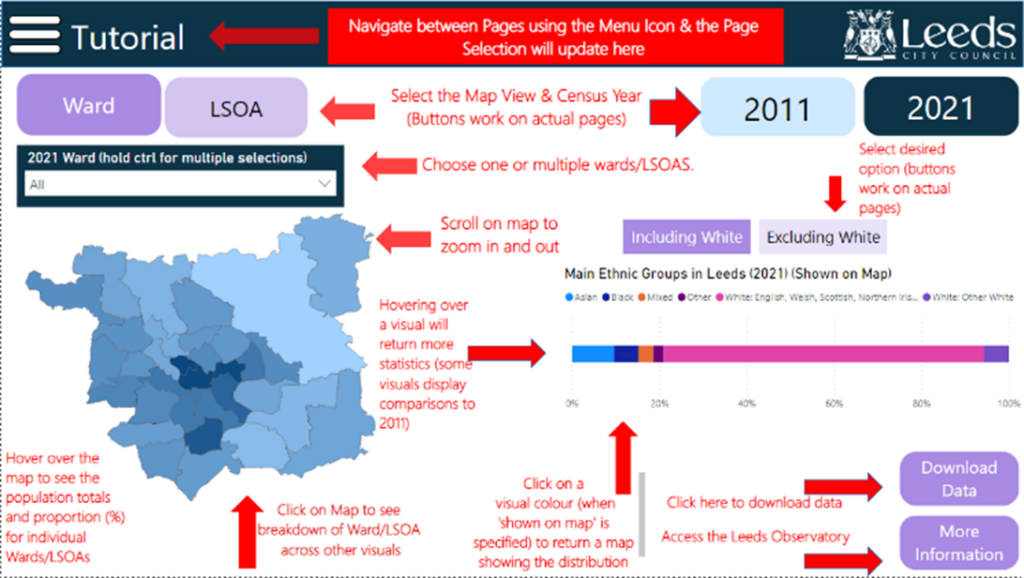
Figure 1: Screenshot of the Tutorial page in the census dashboard. This page has text and arrows explaining how to use each section of the dashboard.
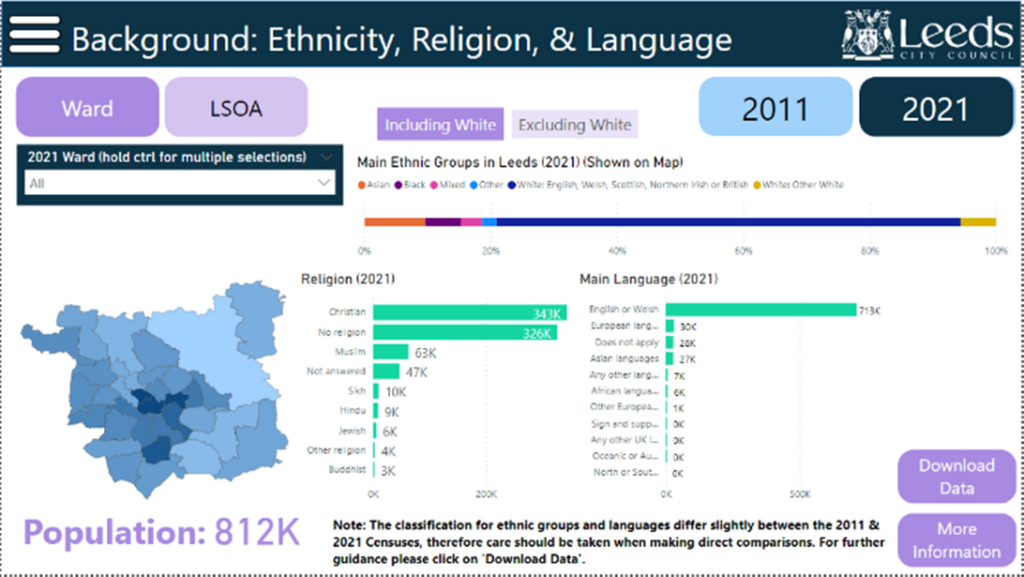
Figure 2: Screenshot of the Background: Ethnicity, Religion, & Language page in the census dashboard. This page has a map of Leeds (which returns a choropleth of ethnicity). It has three bar charts demonstrating Ethnicity, Religion and Language. It is interactive, where a user can click on the map or select a Ward or LSOA which returns the statistics for that area in 2011 or 2021. Tooltips (Pop-ups) appear on every visual providing more information.