Home » Archives for Kylie Norman

New partnership pilots trials to help change eating habits

New partnership pilots trials to help change eating habits

What we choose to put into our shopping baskets and how we make those choices will come under the microscope in a series of pilot trials designed to encourage healthy and sustainable diets.

Data analysts from the University of Leeds have joined forces with social impact organisation, the Institute of Grocery Distribution (IGD), to test different ways to encourage healthy and sustainable eating.

They are working in partnership with 20 leading retailers and manufacturers, including Morrison’s, Sainsbury’s and Aldi, to trial different strategies, including signposting better choices, the positioning of products in shops and online and the use of influencers and recipe suggestions.

Some have already begun to use some of those techniques in real-life settings as part of the research designed and implemented by the Leeds Institute for Data Analytics (LIDA) and the Consumer Data Research Centre (CDRC).

Researchers from LIDA and CDRC will analyse the results by capturing and measuring sales data from each intervention, enabling the project group to see exactly what is going on in people’s shopping baskets and assess what truly drives long-term behaviour change.

Dr Michelle Morris, who leads the Nutrition and Lifestyle Analytics team at LIDA and is a CDRC Co-Investigator, said: “I am passionate about helping our population move towards a diet that is both healthier and more sustainable. I believe that unlocking the power of anonymous consumer data, collected by retailers and manufacturers, is a really important step towards this goal.

“Working with the IGD and its members to evaluate their healthy and sustainable diets programme is very exciting – testing strategies to change purchasing behaviour and evaluating the wider impact of these changes.”

The pilot trials have been funded by IGD and form a key part of the charity’s Social Impact ambition to make healthy and sustainable diets easy for everyone.

Hannah Pearse, Head of Nutrition at IGD, said: “We want to lead industry collaboration and build greater knowledge of what really works. Our Appetite for Change research tells us that 57% of people are open to changing their diets to be healthy and more sustainable, and they welcome help to do it. But we also know that people don’t like to be told what to do and information alone is unlikely to change behaviour.

“We believe consumers will make this transition if we make it easier for them; that’s why we are delighted to be partnering with our industry project group and our research partners at the University of Leeds, to pilot this series of interventions over the coming months. The team at LIDA are experts in capturing, storing and analysing big data and have a variety of academic specialties that will be critical for this work.”

The work being carried out by CDRC researchers at the University of Leeds is unique because it will use the secure infrastructure at LIDA to allow retailers and manufacturers to share anonymised transaction data over a sustained period of time.

It is hoped that the results of the first pilot trial will be published towards the end of this year.

New Insights into workplace and retail dynamics for England and Wales

New Insights into workplace and retail dynamics
for England and Wales

CDRC data scientist intern Sebastian Heslin-Rees, working with Dr Nik Lomax, Dr Stephen Clark, and Dustin Foley developed a classification of commercial and employment land use in England and Wales using location and time-series data

Commercial areas and the businesses that inhabit them are not just an important addition to the vitality of urbanised areas but in many ways are essential to the ability of these places to flourish. This project has been utilising the newly available Whythawk dataset to construct a model for presenting and thus, understanding the spatial distributions of commercial areas across England and Wales. Largely, this has involved clustering workplaces of similar characteristics to distil a set of key workplace types, which can then subsequently be mapped and analysed. The Whythawk dataset is more detailed and up-to date than previous workplace/commercial classifications, which have been built from 2011 census data. Consequently, this could provide additional insights and novel avenues for academic research, policy initiatives and location analysis.

Data and methods

The Whythawk data contains details of commercial properties across England and Wales. It contains data such as the type of commercial property, the floor space, and employee count and business revenue. The data comes from both Valuation Office Agency and from local councils.

At the heart of our methodology is an unsupervised machine learning approach known as K-means++. Essentially, K-means++ groups variables of similar characteristics into the same cluster, to distil a specified number, K, of distinct clusters. It does this by minimising the total squared Euclidean distances between the cluster centroid and the data points within that cluster. In our case we used the percentages of floor space of each commercial type per postcode zone (e.g. LS15 8G). To add another layer of nuance to our classification and help further the distinctions between the clusters, we also generated and included an array of additional factors. These factors were selected based upon how they could impact the perceived attractiveness of an area, especially when viewed through the lens of retail and commercial attractiveness. For this we created an index of commercial diversity, rates of crime per business, as well as including measures for degree of urbanisation and accessibility by rail, road and bus.  

Key findings

We produced nine distinct classification types from the k-means clustering algorithm, labelled as follows: Urban mixed commercial land use (Retail focused), Public services, Diverse Industrial and warehousing areas, Urban office spaces, Less urbanised mixed commercial land use (warehousing, retail and leisure spaces), Low diversity Industrial areas, More urbanised and diverse public services, High street retail and As yet untitled (mixed). Moreover, there was also substantial variation in distribution across the nine clusters when examining our additional variables (Crime per business, Diversity, Degree of urbanisation and Accessibility). For instance, Figures 1 and 2 below display an example of the composition of clusters 1 and 4. We can see that the clusters are distinct in their composition of commercial activity. Notably, cluster 1 demonstrates significant diversity of commercial activity, whilst incorporating a large retailing component, whereas cluster 4 has a very low diversity focusing mostly on office spaces.

Figure 1 Catplot displaying the composition of cluster one, urban mixed commercial land use

Figure 2 Catplot displaying the composition of cluster four, urban office spaces

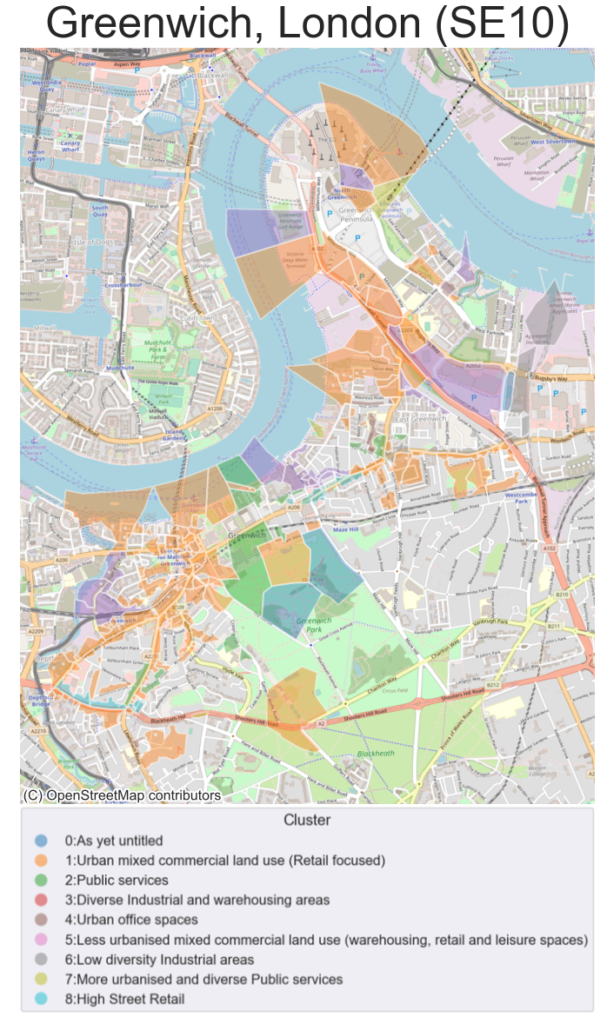
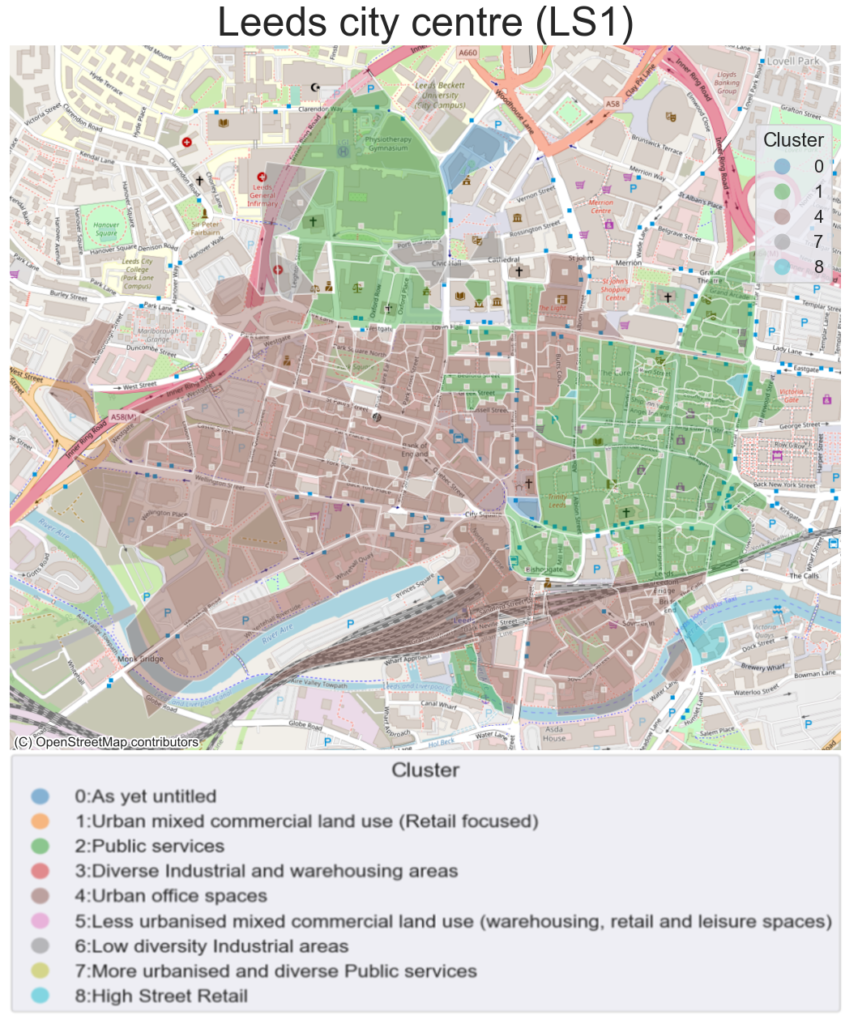
The clusters were subsequently mapped at Unit Postcode level. All postcodes with a cumulative commercial floor space below 100m2 were removed, so that the spatial distribution and characteristics of key commercial space can be examined. Two examples of this mapping can be seen below in Figures 3 and 4.

Figure 3 Map of Greenwich (SE10) in South-East London by commercial cluster type

Figure 4 Figure 3 Map of Leeds city centre (LS1) by commercial cluster type

Lastly, this model can be combined with other data points to provide additional utility for businesses. One avenue for this is examining how business rateable and rentable values compare across the distinct cluster types. For instance, clusters 0, 2 and 4 have their mean and median rental and rateable values significantly above clusters 1, 5 and 8.

Value of the research

The results could be used by businesses to readily locate commercial areas of interest when performing tasks such as determining optimal locations for new store outlets. Additionally, this model can be used in conjunction with many other research endeavours concerning urban analytics that seek to determine the characteristics and dynamics of urban areas. For example, this may be in terms of examining workplace and neighbourhood dynamics, commuting flows as well as retail and high-street health.

Insights

  • Utilising novel datasets combined with unsupervised machine learning.
  • Developing a unique classification concerning commercial land use across England and Wales.
  • Providing insight into urban dynamics.

Project Team

Sebastian Heslin-Rees – Data Scientist Intern, University of Leeds

Dr Nik Lomax – Project supervisor, University of Leeds

Dr Stephen Clarke – Research fellow, University of Leeds

Dustin Foley – Data scientist, University of Leeds

Partners

Whythawk

Consumer Data Research Centre (CDRC)

Funders

Consumer Data Research Centre (CDRC)

Local Data Spaces: Supporting Local Authority Covid-19 Response (Data Story)

Local Data Spaces: Supporting Local Authority Covid-19 Response (Data Story)

Covid-19 has strained already insufficient Local Authorities resources, with infection and transmission of Covid-19 further exacerbating existing social inequalities. Four CDRC academic researchers (Dr Mark Green, Dr Jacob MacDonald, Dr Maurizio Gibin and Simon Leech) have been working for the past 6 months using the Office for National Statistics Secured Research Service (ONS SRS) on the Local Data Spaces project.

The Local Data Spaces (LDS) was a novel collaboration between the Joint Biosecurity Centre (JBC), the Office for National Statistics (ONS), and ADR UK. This project was set up to support local authorities, groups and stakeholders respond to the COVID-19 pandemic using granular and secured data and research driven analyses.

After engaging the JBC and 25 local authorities, we identified two consistent core research priorities which focused on broader COVID-19 health impacts and inequalities, and on economic vulnerability and recovery potential. From this, we developed a series of nine reports leveraging the secured data available through the SRS infrastructure – and further replicable and generated consistently for all local authority regions across the country (and available via the CDRC Geodata Packs platform).

For each local area, a set of reports are built to profile the themes of:

  • Demographic Inequalities in COVID-19;
  • Ethnic Inequalities in COVID-19;
  • Geospatial Inequalities in COVID-19;
  • Excess Mortality;
  • Occupational Inequalities;
  • Population, Housing and Affordability;
  • Industry Densities; Economic Vulnerabilities;
  • Human Mobility.

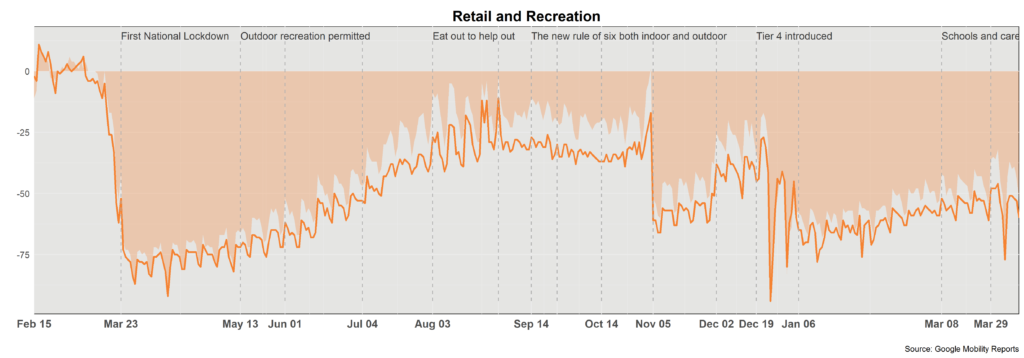
One of the outputs in the reports, allowing used to compare changes in retail and recreation over time for the country (area) and their local authority (line).

We made use of the highly detailed administrative and survey datasets held securely within the Office for National Statistics (ONS) Secure Research Service (SRS), including core national data products such as NHS Test and Trace, the COVID-19 Infection Survey, The Business Structure Dataset (BSD) registry and the Business Registry and Employment Survey (BRES). Non-disclosive research work was conducted within the SRS environment, and generated into the series of reports for each area across England. These data sources were supplemented where relevant with openly available datasets such as the ONS Population Estimates, Google Mobility Data, and CDRC open data products such as the CDRC Business Census, and Access to Healthy Assets and Hazards (AHAH).

From our meetings with local stakeholders, it became clear the huge variation in resources available for research and analytical capacity, and that the Covid-19 pandemic has stretched resourcing within local authorities. Local authorities co-designing analyses alongside the research team ensured the reports generated were relevant and useful, and helped fill evidence gaps at local levels.

We created non-disclosive outputs from the ONS SRS packaged into a series of reports for each local authority district in England. These reports are available through the CDRC Geodata packs platform for any local stakeholder to download. All R scripts, both for data cleaning and analyses are available for re-use by local authority analysts or local researchers in the future, enabling reproduction and even extension of the analyses. The openly-available (appropriately disclosed where necessary) code and workflow pipelines used to clean and format these datasets and produce final reports provide a number of practical efficiencies. Where local analysts have limited resources or capabilities in accessing, working and analysing massive national studies and datasets, cleaned scripts and code to bypass the data wrangling stage can be invaluable when rapid-response research outputs are needed. Alongside this, we hope this may empower those local authorities with lower analytical capacity to be able to access granular data to inform local level evidence bases.

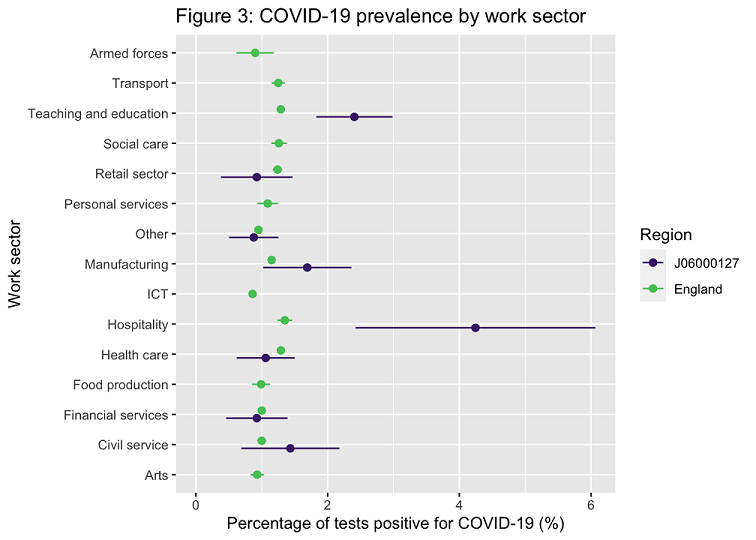
Another output from the data pack reports, allowing users to compare positive Covid-19 rates by work sector for England (green) and their area (purple).

In the short term, reports will be used by local authorities and stakeholders, allowing them access to an evidence base of the impact of Covid-19 at a local level. The way the reports and replicable code are available to other accredited researchers within the SRS (and available appropriated disclosed external to the SRS) allow local authorities to explore these avenues for their own local research priorities. Locally focused research and data is clearly in demand and this resource will be a key part in local authorities’ response to Covid-19.

These reports and data can be accessed here:

Post-Covid Resilience of Commuter Towns

Post-Covid Resilience of Commuter Towns

Utilising open source and aggregated retail data through the CDRC secure data service, co-funded Ph.D. student Abigail Hill has created an index of retail resilience and recovery from the Covid-19 pandemic for English commuter towns. Business partner Retail Economics has interested in improving understanding of the impacts of increased ‘working from home’ on commuter town high streets and their immediate and longer-term impacts upon retail resilience.

Abigail’s analysis develops six case studies and finds that of these Guildford has the most resilient commuter town high street, while Rochdale has the least. Cluster analysis also reveals that despite Rochdale high street’s relative weakness, some of the retail areas that adjoin it have better prospects, especially where retail activity projects a strong and unified image. GIS analysis also found that there are specific parts of both Guildford and Rochdale high streets that share similar levels of retail vacancy and occupier turnover and which may each require tailored interventions to restore stability.

This research project was carried out as part of a co-funded Ph.D. with the Local Data Company (LDC) under the ESRC Accelerating Business Collaboration scheme. The work had two related components.

First, a resilience index for commuter towns was developed using data sources to represent four domains: wealth, vacancy, retail composition and consumer spending. Office for National Statistics (ONS) open data were used to create indicators of local income, occupational structure, house prices, relative location and consumer spending. Local Data Company data on location, retail unit type and vacancy were used to create summary indicators of high street and adjoining area vacancy rates, levels of trading in essential retail categories, share of chain store occupancy and presence of leisure venues. The methodology entailed data standardisation and factor analysis.

In the second stage, the highest and lowest ranked towns were used to develop detailed case studies. Retail boundaries were developed using LDC data and used to explore the vitality of high streets and adjoining areas. DBSCAN and hierarchical clustering techniques were used to identify areas within high streets that merited locally targeted interventions.

The majority of the data sources used were open data. Secure LDC data were also used to create data aggregations used to create retail area boundaries.

Reflecting on the project, Retail Economics CEO Richard Lim said:

This was an extremely valuable piece of research to Retail Economics which focused on a very important emerging trend in the industry. The research was timely, relevant and forward looking. The process was also well-managed and all stakeholders worked together well to add value in their respective areas of expertise.

In particular, Abi was well organised, enthusiastic and a great communicator which helped keep the project on track and delivered within the time scales set out at the start of the year. The final presentation of the research was delivered in an engaging and succinct manner, aligning very much to the business community.

We will look to leverage value out of the research in our internal analysis to assess the impact of Covid-19 on shopping habits with a particular focus on the commuter belt. There is a depth of quality and rigour within the research that provides confidence in the initial findings that we can share with our clients. Overall, an excellent piece of research.

The Retail Economics website is https://www.retaileconomics.co.uk/about.

CDRC Open Data Survey & Prize Draw

CDRC Open Data Survey & Prize Draw

The CDRC is currently conducting a review of past and ongoing applications of our data sets.

Users of our open data services are invited to participate in a short survey. Completing the survey will automatically enter you into a prize draw, with a chance of winning one of four Amazon gift vouchers:

1 x £200

1 x £100

2 x £50

We will contact the winning participants with details of how to claim their prize shortly after the survey closes on November 13th 2020.

We are gathering information to track the applications of our data services and to better develop our services with our users’ needs in mind. As an open and accessible data service provider, user feedback is crucial to improve the service CDRC provides and to maintain CDRC as a user-centric platform.

All of those users who have registered to access our open datasets should have received an email for the survey. If you have not, and would like to contribute, the survey is available online at https://liverpool.onlinesurveys.ac.uk/cdrc-open-data-survey .

Please contact james.brookes@liverpool.ac.uk or info@cdrc.ac.uk if you have questions about completing the survey.