A New Year can mean New Year’s resolutions. Commonly these revolve around weight loss, joining the gym or being more active. Though most people start with good intentions, many resolutions don’t last throughout the year (or even this far into the year!). Equally, many other factors influence how active we are at different points in the year.
With our research, we were interested in identifying whether there are different patterns of activity behaviour in different groups. And, in addition, how these patterns over time were linked to other characteristics such as age, gender and preference of activity type.
We investigated patterns of activity over both the week and the year using daily step count data. Interested in shorter term activity patterns, we wanted to know if people were more active mid-week or on weekends. We were also keen to understand whether activity behaviour was consistent throughout the year or whether it fluctuated across the seasons. Using a cohort of physical activity tracking app users (for more info see previous blog post) we utilised over 30,000 years’ worth of activity across more than 1,000,000 user recorded weeks.
Yearlong activity pattern insights
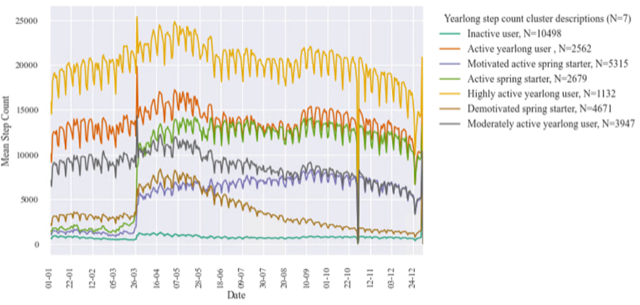
Looking at behaviour across the year, users fall into seven distinct patterns of behaviours, known as clusters (Figure 1). At the bottom of figure 1 we have the “inactive cluster” (turquoise) who were inactive pretty consistently across the year. On the flipside, the yellow ‘highly active yearlong cluster’ were consistently active throughout the year, on average exceeding 15,000 steps a day (equivalent to around 7 miles a day).

Several of the other clusters follow the same pattern as the highly active cluster, but at lower activity intensities (the orange and grey clusters). The spikes at the end of March and October indicate the start and end of UK daylight saving. The impact of daylight saving on activity is demonstrated with higher activity in the summer months (more hours of daylight and generally better weather) compared to the winter months. In contrast to the clusters showing seasonal variation in activity, we also see evidence of users showing both motivated activity behaviour – increasing activity as the year progresses (purple cluster) – and demotivated activity behaviour, where the reverse is true (brown cluster).
Weekly activity patterns insights
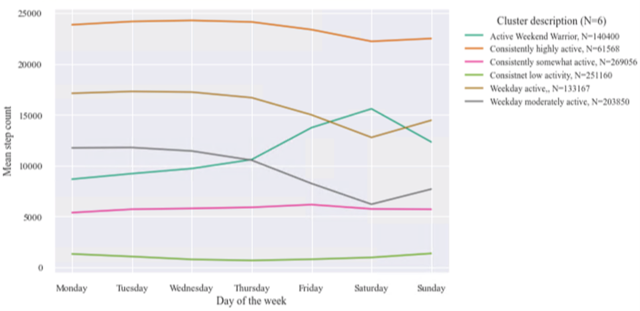
Similar analysis investigating weekly behaviours, shown in figure 2, demonstrates how, across the week, users show six distinct patterns of behaviour. Three groups are consistent in their activity level at either a low, somewhat or high physical activity intensity (green, pink and orange clusters). Two groups were more active during the week with lower levels on activity on the weekends, again at different levels of activity intensity, indicative of activity associated with commuting (the brown and grey clusters). The final group, the ‘weekend warriors’, were more active on the weekend than weekdays (teal cluster).

Consistent activity throughout the week was associated with recording more active minutes overall and was therefore more likely to meet physical activity guidelines than those just active on weekdays or weekends.
Demographic insights
Users in the different clusters also displayed different demographic characteristics. Older age was associated with being in the most active cluster of yearlong behaviour. A user in the most active cluster was also more likely to be male, but the same is true as well for the inactive cluster. Female users were more likely to be in the moderately active groups, or show motivated or demotivated behaviour across the year, rather than the typical seasonal fluctuations in activity.
Moreover, users tended to record a variety of different weekly activity patterns across the year – for instance, three weeks of weekday active behaviour might be followed by a couple of highly active weeks. Different weekly activity clusters were more predominant in the overall yearlong activity behaviours. Unsurprisingly, the highly active yearlong cluster was made up of users who recorded a large proportion of weeks which were classed as highly active. Those who were active during weekdays were also more likely to be active throughout the year. This enables us to build up the picture of how shorter-term activity patterns contribute to longer term habitual activity.
By targeting policy towards the shorter- and longer-term clusters of behaviour we can increase overall activity. For example, guiding those usually only active during the week to accessible weekend activities such as Parkrun, or suggesting ways to incorporate activity mid-week for the ‘weekend warriors’. Looking at seasonal activity we can start to investigate interventions to stop activity levels dropping with the reduced hours of daylight in winter, such as better street lighting or greater provision of indoor activities.
The full paper is openly available: https://doi.org/10.3390/ijerph182111476

Fran Pontin is a CDRC Research Data Scientist and former Data Analytics and Society CDT student. Her PhD looks at the utility of secondary smartphone app data in capturing physical activity behaviour over a wide spatial scale. With a background in Food Science and Nutrition, her research interests lie in the use of consumer data to capture and better understand health behaviours and drive targeted policy change. Fran also provides Python training on behalf of the CDRC, aiming to make the analysis of large-scale consumer data accessible to a wider audience.

