Home » Health & Wellbeing

Fruit and Veg Findings – IGD behavioural insights report follow-up

Fruit and Veg Findings – IGD behavioural insights report follow-up

November 2020 brought a series of sustainability goals to the forefront with COP26, and linked initiatives such as the Earthshot Prize, rightly monopolising media attention. Tackling climate change was not only of great importance to policy makers in Glasgow, but also to companies and consumers around the world.

Our global food system is the second biggest contributor to climate change [1]. Retailers and manufacturers in the UK food industry are responding to this and are working hard to be a driving force of change. IGD’s Healthy and Sustainable Diets Project Group and WWF’s recent Retailers’ Commitment for Nature are examples of the brilliant collaboration happening in the sector to reduce the toll that our weekly food shops have on the environment.

This November also saw the release of the Institute of Grocery Distribution’s (IGD) Behavioural Insights Report. The report shares the first findings from our ongoing research, in partnership with IGD and their Healthy and Sustainable Diets Project Group, where we look at how healthy choices and sustainable choices can be one and the same.

Can food retailers and manufacturers make the shift towards a healthy and sustainable diet easy, accessible and appealing to consumers at the point they are purchasing and planning their food for the week?

To investigate this, interventions have been co-designed by IGD, members of IGD’s Healthy and Sustainable Diets Project Group and the University of Leeds, to trial one or several of the behavioural levers below.

A 4-week national price reduction trial to encourage greater fruit and veg, tested year on year

The first exciting trial we have been studying is Sainsbury’s ‘60p Fruit and Veg’ campaign.

Looking to increase the amount and variety of fruit and vegetable products in shoppers’ baskets, Sainsbury’s ran a promotional intervention for four weeks in both January 2020 and January 2021. These promotions reduced the price of selected fruit and vegetables to 60p in store and online.

Signposting and placement were used alongside incentivisation to draw attention to the offer. Our research aimed to determine whether this multi-levered approach led people to make healthier and more sustainable choices, and monitor whether any change was sustained in the nine months following the trial.

The trial was varied each year in the selection of fruit and vegetables chosen for the offer: thirteen products were on offer in 2020 and seven in 2021. Furthermore, the first trial in 2020 was outside of national lockdowns, whereas the second trial, in 2021, occurred during one.

Studying 23.4 million baskets

For our initial findings, we analysed national unit sales data for 23.4 million baskets that contained a promoted fruit or vegetable item between January 2019 and March 2021. Following the sales over this period allowed us to observe purchasing trends and establish a comparative January 2019 baseline for each product.

Our findings

Our analysis is presented in terms of portions, reminding us of the impact our consumer choices have in terms of our plate. To calculate this, each unit sold was translated into portions as defined by product weight, where one portion of fruit or vegetables is equivalent to 80g [2].

An impactful intervention year on year

Our first finding was pleasing, yet slightly expected: when on offer, sales increased for the promoted items.

Promoting fruit and veg increased sales by over two million portions, compared to the control year

Each year we saw an uplift in sales during the promotional period, well above the January 2019 baseline for the selected products. In total, 2.8 million more portions of promoted fruit and vegetables were sold in 2020 during the four weeks of the promotion than the previous year, across 101 stores which ran the intervention in both years. Similarly, 2.1 million more portions were sold during the 2021 promotion than in the same period in 2019, for the 101 stores.

Less impact during the national lockdown

Consumers engaged with the promotion each year, purchasing promoted products well above their 2019 levels. While both years of the promotion were successful, the second year saw slightly less impact than the first. Sales of the promoted items increased from baseline by 78% (2.8 million portions) in 2020 and by 56% (2.1 million portions) in 2021.

The 2021 trial took place during a national lockdown, when food shopping became a more pragmatic procedure. Placement and signposting were therefore probably not as strong at directing shoppers’ attention and influencing their basket.

Prior to starting our analysis, we anticipated the data may reflect effects of the pandemic alongside the effects of the trial. It is important to keep this context in mind when interpreting the data. The lower portions sold in the second year may be partly attributed to the different food landscape, however, we also have to bear in mind the differing items on promotion.

Below you can see a timeline of average portions sold per store from 2019-2021, across the 101 stores (noting it only considers items offered in the promotion). The figure illustrates seasonal shifts in consumer behaviour, essential to developing a holistic understanding of the trial’s impact.

Weekly plot of mean portions sold per store for Fruit or Vegetable items offered in the promotion. Unit Sales data was provided by Sainsbury’s. Calculated across the restricted subset of 101 stores which ran the 60p Fruit and Vegetable promotion in both years.

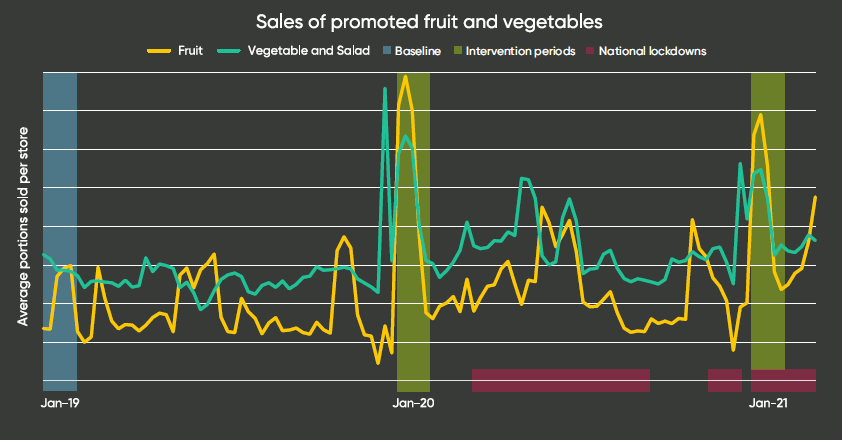
Looking at the highlighted intervention periods, we observed a sales spike in both January 2020 and January 2021 during the promotion, emphasising those 2+million additional portions sold in each year.

Impactful, but not sustained

The timeline above plots weekly sales data. Curiously, the high level of engagement drops off in the final week of each trial. This decline may reflect people’s finances prior to payday, or may suggest that using Placement and Signposting only interrupts behaviour for a short time before going unnoticed by shoppers [3].

Some products were more appealing than others

Higher-value items were most popular, such as kale, kiwi fruit, pineapple and mango. Noticeably, these items also require minimal preparation and mostly encompassed exotic fruits. In contrast, swedes, radishes and red grapefruits were less popular in the promotion.

January – a popular month for fruits and vegetables

Important questions to understand, with the goal of encouraging people to embrace healthier and more sustainable diets, are: were customers adding items to their basket to up their fruit and vegetable content overall? Was this a shift within their usual purchasing habits?

For the last two years, around four million more units of fruit and vegetables were sold in January than the following February. Promoted items made up 9% of produce purchases during the four-week intervention period in January 2020 (dropping down to 5% in the four weeks that followed), and 8% during the four-week intervention period in January 2021 (dropping down to 6% in the four weeks that followed).

These figures indicate that the promoted items contributed to the high fruit and vegetable sales in January, but did not fully account for the uplift. There are many reasons why people may have picked up more fruit and vegetables in January, such as the growing Veganuary movement or a healthy eating New Year’s resolution. So, how do we determine the promotion’s success apart from a January health kick? Studying one year pre-intervention allowed us to establish baseline sales for the selected products. The 2+million portions sold above baseline indicates that the sales spike in January 2020 and 2021 can be largely attributed to the promotion.

Next stages

So, are promotional interventions successful? Sainsbury’s 60p Fruit and Vegetable promotion was extremely successful initially, causing a short-term sales uplift for items on offer.  However, we saw this was not sustained as sales declined in the fourth week.

Our next step is then to look across people’s baskets and see what other items they were purchasing. Was their basket closer to the Eatwell Guide (the model diet we use as a metric to measure success) when engaging with the promotion?

There are many exciting developments in the wider work ahead for this partnership. More trials are underway, watch this space!


About the Author: Alexandra Dalton currently works as a Data Scientist at the Consumer Data Research Centre following her data science internship at the Leeds Institute for Data Analytics (LIDA). Alex and a team of researchers from the University of Leeds have worked in collaboration with IGD, major retailers and UK manufacturers to evaluate strategies to promote healthier and more sustainable dietary choices. She is interested by consumer data insights in the intersectional field of sustainability, nutrition and lifestyle analytics.


[1] National Food Strategy (2021). The National Food Strategy: The Plan. [Accessed online via: https://www.nationalfoodstrategy.org/ ]

[2] NHS (2018). 5 A Day: what counts? [Accessed online via: https://www.nhs.uk/live-well/eat-well/ ].

[3] IGD (2020) Healthy, Sustainable Diets: Driving Change [Accessed online via: https://www.igd.com/articles/ ].

Physical activity behaviour over time – who, how much and when

Trainer clad feet moving right to left along a thin path in the middle of green grass

Physical activity behaviour over time – who, how much and when

A New Year can mean New Year’s resolutions. Commonly these revolve around weight loss, joining the gym or being more active. Though most people start with good intentions, many resolutions don’t last throughout the year (or even this far into the year!). Equally, many other factors influence how active we are at different points in the year.

With our research, we were interested in identifying whether there are different patterns of activity behaviour in different groups. And, in addition, how these patterns over time were linked to other characteristics such as age, gender and preference of activity type.

We investigated patterns of activity over both the week and the year using daily step count data. Interested in shorter term activity patterns, we wanted to know if people were more active mid-week or on weekends. We were also keen to understand whether activity behaviour was consistent throughout the year or whether it fluctuated across the seasons. Using a cohort of physical activity tracking app users (for more info see previous blog post) we utilised over 30,000 years’ worth of activity across more than 1,000,000 user recorded weeks.

Yearlong activity pattern insights

Looking at behaviour across the year, users fall into seven distinct patterns of behaviours, known as clusters (Figure 1). At the bottom of figure 1 we have the “inactive cluster” (turquoise) who were inactive pretty consistently across the year. On the flipside, the yellow ‘highly active yearlong cluster’ were consistently active throughout the year, on average exceeding 15,000 steps a day (equivalent to around 7 miles a day).

Figure 1: yearlong activity behaviour clusters

Several of the other clusters follow the same pattern as the highly active cluster, but at lower activity intensities (the orange and grey clusters). The spikes at the end of March and October indicate the start and end of UK daylight saving. The impact of daylight saving on activity is demonstrated with higher activity in the summer months (more hours of daylight and generally better weather) compared to the winter months. In contrast to the clusters showing seasonal variation in activity, we also see evidence of users showing both motivated activity behaviour – increasing activity as the year progresses (purple cluster) – and demotivated activity behaviour, where the reverse is true (brown cluster).

Weekly activity patterns insights

Similar analysis investigating weekly behaviours, shown in figure 2, demonstrates how, across the week, users show six distinct patterns of behaviour. Three groups are consistent in their activity level at either a low, somewhat or high physical activity intensity (green, pink and orange clusters). Two groups were more active during the week with lower levels on activity on the weekends, again at different levels of activity intensity, indicative of activity associated with commuting (the brown and grey clusters). The final group, the ‘weekend warriors’, were more active on the weekend than weekdays (teal cluster).

Figure 2: weekly activity behaviour clusters

Consistent activity throughout the week was associated with recording more active minutes overall and was therefore more likely to meet physical activity guidelines than those just active on weekdays or weekends.

Demographic insights

Users in the different clusters also displayed different demographic characteristics. Older age was associated with being in the most active cluster of yearlong behaviour.  A user in the most active cluster was also more likely to be male, but the same is true as well for the inactive cluster. Female users were more likely to be in the moderately active groups, or show motivated or demotivated behaviour across the year, rather than the typical seasonal fluctuations in activity.

Moreover, users tended to record a variety of different weekly activity patterns across the year – for instance, three weeks of weekday active behaviour might be followed by a couple of highly active weeks. Different weekly activity clusters were more predominant in the overall yearlong activity behaviours. Unsurprisingly, the highly active yearlong cluster was made up of users who recorded a large proportion of weeks which were classed as highly active. Those who were active during weekdays were also more likely to be active throughout the year. This enables us to build up the picture of how shorter-term activity patterns contribute to longer term habitual activity.

By targeting policy towards the shorter- and longer-term clusters of behaviour we can increase overall activity. For example, guiding those usually only active during the week to accessible weekend activities such as Parkrun, or suggesting ways to incorporate activity mid-week for the ‘weekend warriors’. Looking at seasonal activity we can start to investigate interventions to stop activity levels dropping with the reduced hours of daylight in winter, such as better street lighting or greater provision of indoor activities.

The full paper is openly available: https://doi.org/10.3390/ijerph182111476


Fran Pontin is a CDRC Research Data Scientist and former Data Analytics and Society CDT student. Her PhD looks at the utility of secondary smartphone app data in capturing physical activity behaviour over a wide spatial scale. With a background in Food Science and Nutrition, her research interests lie in the use of consumer data to capture and better understand health behaviours and drive targeted policy change. Fran also provides Python training on behalf of the CDRC, aiming to make the analysis of large-scale consumer data accessible to a wider audience.

Smartphone Apps and Activity – tracking trends in who, how and when we move

Someone doing up a shoelace and wearing a fitness tracker watch

Smartphone apps and activity – tracking trends in who, how and when we move

The advantages of being physically active have never been more apparent, with proven benefits across a wide range of health conditions. Traditionally, we might consider the beneficial role of physical activity to be in reducing obesity incidence and preventing non-communicable diseases, such as cardiovascular disease and type 2 diabetes. However, the COVID-19 pandemic has thrown further positives into the spotlight, as being physically active has been shown to reduce the risk of severe COVID-19 outcomes. Moreover, lockdowns and state-sanctioned time for exercise highlighted the importance of physical activity to mental health and wellbeing.

Physical inactivity is responsible for 1 in 6 deaths in the UK (equivalent to the risk from smoking1), with 1 in 3 men and 1 in 2 women not meeting the recommended 150 minutes of moderate to vigorous activity a week1. To reduce physical inactivity, we need to identify and remove the barriers to being active. These barriers are diverse and wide ranging, varying from person to person. Examples include, but are not limited to: increasingly sedentary occupations, time or monetary constraints and environments that do not support activity.

To best identify what and where these barriers to being active are, we need to establish a good understanding of where, when and how people are active. However, studies investigating physical activity behaviour are typically limited by sample sizes, small study areas and shorter study durations.

Increasingly, individuals are monitoring their own activity and fitness levels using smartphone apps or wearable trackers such as Fitbit, Garmin or smartwatches. Secondary use of these consumer data can provide researchers with new insights into physical activity behaviour. In this research, we use secondary app data provided by FUELL Ltd‘s Bounts app (available for use by researchers via application to the CDRC). We evaluate how useful secondary smartphone data are in providing insight into how active the public are. To do this, we first need to assess how representative app users are of the population as a whole. Finally we uncover key activity behaviours associated with different age and gender user profiles.

The app – who is using it?

The Bounts app was commercially available on all major app provider stores, with users earning points for activities which could later be exchanged for vouchers and prizes. All user data is pseudonymised and no identifiable user information is shared with the researchers. Additionally, data is only accessible to those with data security training and in a data secure environment.

We used the data of 30,804 app users who recorded seven or more days of activity in 2016. With an average user age of 39, women make up a significantly larger proportion of app users (77.7% of users). 43.8% of users provided a postcode district which we linked to the Office for National Statistics socioeconomic classification. Unlike traditional studies, which tend to underrepresent lower socio-economic groups, we found there was no substantial socioeconomic difference in the areas where Bounts users lived compared to the general population.

Research highlights

Seasonal and weekly trends in physical activity behaviour

Users recorded on average 218 days of activity, which is substantially longer than the typical seven-day data collection period in traditional physical activity studies. Thanks to this long monitoring period, we were able to observe distinct patterns in activity behaviour across weekly and seasonal timeframes.

Across the year, we can see the role daylight saving plays, with a higher number of activities recorded by users over the summer months when evenings are longer, dropping off in autumn as the days get shorter (Figure 1).

Figure 1 – Seasonal trend heatmap of total daily activity recorded by all app users
Figure 2 – Heatmap of total daily activity recorded by all app users standardised by week, highlighting weekly patterns of behaviour

We can also see a weekly pattern in activity behaviour with the highest number of activities recorded mid-week, peaking on Tuesdays (Figure 2). Higher weekday activity levels are suspected to be functional activity around commuting behaviours. This goes against the ‘weekend warrior’ theory that individuals tend to exercise more on the weekends and less on weekdays.

A higher level of functional activity is associated with women and those in less affluent socioeconomic groups. This corresponds to our user sample which has a high proportion of women and captures users from less affluent socioeconomic groups, who are usually underrepresented in physical activity studies.

Who is meeting the physical activity guidelines?

For each week that a user recorded activity, we calculated whether the culmination of this activity was enough to meet physical activity guidelines of 150 minutes of moderate to vigorous activity per week. This includes any activity with greater or equal intensity to brisk walking.

Despite the known health benefits, the overall proportion of weeks meeting these physical activity guidelines was low. The youngest and oldest users were the least likely to meet the guidelines, with those aged 35 to 44 most likely to meet the sufficiently active threshold.

Men were almost twice as likely to meet the guidelines, with 24.2% of weeks recorded by male users classed as adequately active compared to 12.4% of weeks recorded by female users. Additionally, living in the most affluent area compared to the least affluent (in terms of employment), improved the odds of recording an active week by almost 5%.

How useful are secondary smartphone data?

Secondary smartphone data are an invaluable tool to provide new insights into physical activity and other health behaviours, as they give a breadth and depth of detailed data not available from other methods.

On the flip side, using these data requires careful consideration, including meticulous implementation of data anonymity and ethics, attention to data handling and cleaning processes, and skilled training to be able to handle such a large detailed dataset. Used in tandem with more traditional primary data collection studies, secondary smartphone app data have the capability to address some of the most complex questions around physical activity behaviour.  We are still very much in the infancy of using these data and have just scratched the surface of their full potential.

Read the full paper: Pontin F, Lomax N, Clarke G, et al. Socio-demographic determinants of physical activity and app usage from smartphone data. Social Science & Medicine 2021: 114235.

References

1. Public Health England. Physical activity: applying All Our Health.  2019.

Palatable change from the pandemic – a new food environment?

Palatable change from the pandemic – a new food environment?

Naturally, we are all concerned about our own and our family’s health and, with the rising issue of climate change, many of us are becoming increasingly worried about the health of the planet too. While living a healthy and sustainable lifestyle is becoming a common goal, there are many barriers to making this aspiration a reality [i].

Eating a nutritious diet that minimises environmental impacts is the most important step we can personally take towards this…but what is a healthy and sustainable diet? Looking at our current consumption in the UK, a shift towards a more plant-based diet would be mutually beneficial for ourselves and the planet.

Please note that the plant-based diet we refer to does include meat and animal products, alongside a larger designated portion of vegetables, fruits, pulses and legumes.

The government’s current dietary recommendation from the Eatwell Guide is one example of a sustainable diet consisting considerably of plant-based products. We have, therefore, chosen the Eatwell Guide as our ‘healthy and sustainable diet’ model to shift behaviours towards.

Plate of food including grains, fish, green beans and tomatoes

Many organisations are also becoming increasingly aware that change is necessary and are working to facilitate a shift towards healthier and more sustainable diets [ii] [iii]. The National Food Strategy recently released ‘The Plan’ – an independent review for the Government on the English food system, which has drawn attention from researchers, retailers and policy makers alike.

I was among those eagerly awaiting the report, as here at the CDRC we’ve recently announced our partnership with IGD, which will involve investigating strategies to promote healthier and more sustainable dietary choices.

As an innovative hub utilising consumer data for academic research purposes, such a timely focus for a CDRC partnered project emphasises the reality of the issue we are trying to tackle, along with heightening people’s awareness of the changes we need to imminently make.

Healthier and more sustainable baskets

A number of leading UK retailers and manufacturers have designed a series of pilot interventions as part of IGD’s Healthy and Sustainable Diets Project Group, such as promotions on plant-based burgers or putting healthier options in prime in-store locations. Our team of researchers are assessing which interventions are particularly successful at encouraging consumers towards healthier and more sustainable choices.

Our analysis will study purchases by basket, not the individuals buying them, so all data is anonymised and not traceable back to any customer. Looking across baskets of goods allows us to observe any unintended consequences of the trial: by discretely upping the fruit and vegetable content of our diet towards the recommended third (39%), does it also inspire a reduction in meat or dairy purchases, or any foods high in fats, salts or sugars?

COVID-19 has inadvertently affected many aspects of our lives, from one lockdown to the next. Shopping habits had to change with the Government’s advice to go to the supermarket less frequently and shop local whenever possible. Many of us also experienced first-hand the reduction in pollution levels when travel was restricted, raising awareness of the importance of making more sustainable lifestyle choices. 

Consumer data enables insight into how people’s shopping frequency and habits have changed over this time. Evaluating IGD interventions relies upon analysing the retailer’s transaction data across the 12-week intervention period, along with the 12 months prior and post start date. However, as I’m sure we can all agree, the last 12 months have not been a usual year. This research, therefore, requires a longer period of pre-intervention data (one additional year that also predates COVID-19), and additional analytical approaches to account for this unprecedented time and produce meaningful findings.

Our approach

Firstly, observing changes in supermarkets (such as explicit guidance on one-way shopping routes, one designated shopper per household and an increase in online shopping), our expectation is there will be less variability in the data (i.e. less variety of items in baskets/between shops), with people’s purchases becoming more habitual. It also means in-store cues, such as promotional signposting, may not be as effective as usual with restricted mobility within aisles.

Mindful of the shift to online shopping for many customers, transaction data will be studied across all online purchases as well as in-store.

A key feature to establish about the data, before generating any statistics on shifting behaviours, is gaining a sound understanding of the sample – how representative is it? IGD interventions are trialled at multiple store locations of differing regions and degrees of urbanisation to capture generalisable results for consumers in the UK. Data is also available for matched control stores (with direct regional and demographic comparisons) to control for any changes over the pandemic period, and enable observation of the impact of the intervention rather than local lockdowns.

To counter unusual shopping patterns during the pandemic, with many people purchasing ‘local’ for certain items, we will investigate behaviours within the ‘most loyal’ subset of consumers.

It is also important to look at socio-economic profiles for purchasing patterns. Understanding if certain promotions are more successful with particular demographic groups – for example, men compared to women, or in those living in deprived compared to affluent areas – is crucial. This type of comparison is more important than ever as we know that COVID-19 has hit the poorest the hardest, exacerbating socio-economic inequalities [iv] [v] [vi].

A time for change

Attitudes to food have also changed within the last year. As people spent more time at home, lockdown became a time of culinary experimentation for some, or a struggling time of increased food insecurity for others.

Although experiences of the pandemic have drastically differed, it has been a time of change collectively. For a significant period, food shops were one of the few areas designated essential by the government. People have come to associate choices about their food with an opportunity to take control of something, in a context where other choices have been suspended.

Many people have changed their shopping and cooking habits during this period. We have seen organisations recognise this through the provision of cooking packs and recipe cards at both the value and luxury ends of food retail outlets. Adapting constantly to new legislations and restrictions, our lives are ever changing as the pandemic continues. While we are still changing our culinary behaviours, perhaps this is one opportunity to create a positive outcome and help nudge people towards healthier and more sustainable choices.

Despite analysis being slightly more complex in light of COVID-19, as a result people could be more receptive to IGD interventions. Our hope is that our research will uncover strategies to help retailers and manufacturers take a leading role in anchoring new, positive behaviours that become permanent habits for the wider public.


Alexandra Dalton is a Data Scientist enrolled on the Leeds Institute for Data Analytics internship programme, having graduated from the University of Leeds with a Masters in Mathematics, which included a year of study at the University of Adelaide. She is currently working in collaboration with IGD, major retailers and UK manufacturers as the lead analyst from the University of Leeds team to evaluate strategies to promote healthier and more sustainable dietary choices. Alexandra is keenly interested in sustainability, nutrition and lifestyle analytics, hence enjoying the insights made possible by consumer data to the intersectional field of nutrition and behavioural science in her current research.


References

[i] Institute of Grocery Distribution (2020). Appetite for Change. [Accessed online via:https://www.igd.com/social-impact/ ].

[ii] House of Lords (2019-20). Hungry for change: fixing the failures in food. [Accessed online via: https://committees.parliament.uk/publications/ ] .

[iii] Institute of Grocery Distribution (2020). IGD’s Healthy and Sustainable Diets Project Group. [Accessed online via: https://www.igd.com/articles/].

[iv] Barker, M., & Russell, J. (2020). Feeding the food insecure in Britain: learning from the 2020 COVID-19 crisis. Food Security12(4), 865-870.

[v] Power, M., Doherty, B., Pybus, K., & Pickett, K. (2020). How COVID-19 has exposed inequalities in the UK food system: The case of UK food and poverty. Emerald Open Research2.

[vi] Blundell, R., Cribb, J., McNally, S., Warwick, R., Xu, X. (2021) Inequalities in education, skills, and incomes in the UK: The implications of the COVID-19 pandemic. [Acessed online via: https://ifs.org.uk/ ]