Home » Data Science

Household mixing during COVID-19 lockdowns

Household mixing during COVID-19:
research suggests adherence to lockdowns in England declined over time

The grim prospect of COVID-19 stay-at-home orders is back in the news, with a number of European countries having either introduced new restrictions or reimposed full lockdowns amid rising cases. These developments inevitably raise questions around how we can best shape public health policy to reduce virus transmission.

One key challenge is reducing “risky” interactions between people, such as household visits indoors. We know close proximity and inadequate ventilation increase the chances of the virus spreading, leading to rising rates of illness. Yet our understanding of these household visitation behaviours, and the effectiveness of policy to reduce them, is lacking.

So in our latest research, we analysed mobility data collected from almost one million people in England between January 2020 and May 2021, seeking to understand trends in home visits during the pandemic.

This data was collected via location-based mobile phone apps by the data company Cuebiq, who obtained consent from users for their anonymised data to be used for research purposes. Working with Cuebiq we were able to generate aggregate analyses without obtaining any individual or household data (that is, none of the data we used could be linked to specific people).

Our interest here was in regional and national trends in mobility, and how populations moved around during the pandemic. For each region we developed indicators of visitation rates to residential areas outside of usual home areas, and assessed how these rates varied from baseline levels set in January and February 2020.

What we found

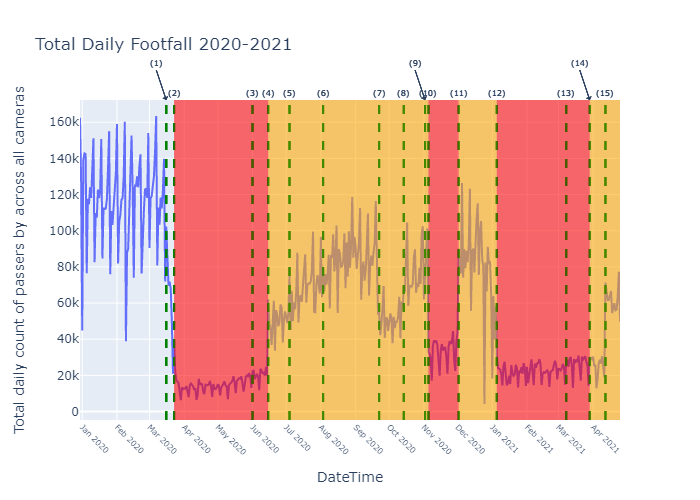
We saw a rapid reduction in people visiting other residential areas during the first lockdown in March 2020. The average decrease over the duration of the first lockdown was 39.3%, while at the lowest point, this activity was 56.4% below baseline levels. Rates of interaction increased prior to the end of the lockdown on May 12, and continued increasing through the spring and summer. But this was a gradual return.

The allowance of support bubbles in June 2020 brought no significant increase in home visits, although a flattening of the rate during August 2020 may indicate that social gatherings moved to restaurants during the operation of the Eat Out to Help Out scheme, or to public outdoor areas with warmer weather. While visitation rates exceed those seen in our baseline months, we can’t tell whether these were indoors or visits to front and back gardens, nor whether the rule of six was followed.

Later national lockdowns saw higher levels of mixing compared to what we observed in March 2020. The second lockdown in November 2020 saw a 15.3% reduction from baseline on average. Activity increased quickly after the end of the November lockdown, potentially due to the run-up to Christmas. The third lockdown, in January 2021, saw around a 26.2% reduction until mid-February.

We observed a significant rise in visitation from mid-February onwards while the third national lockdown continued – within two weeks rising to 23.3% above baseline levels. This increase in activity aligns with the announcement that the UK had offered vaccinations to the first four priority groups, which may have given people confidence to return to social activities at this time.

Graph showing trends in visits to other residential areas.
In this figure, the dots represent the daily mobility data, while the orange line represents a seven-day average. Scientific Reports, Author provided

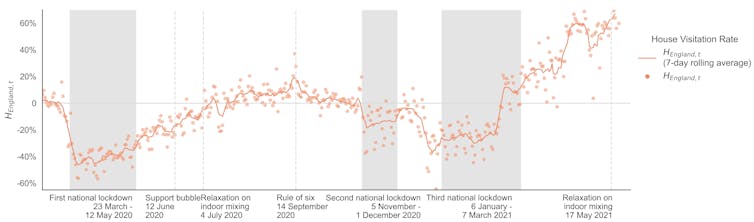
Taken together, the evidence suggests a slowly declining adherence to the stay-at-home rules as the pandemic went on. The underlying reasons for this will be multifaceted, summarised neatly as “lockdown fatigue”, but more precisely relate to increasing perceptions of safety in the face of the vaccine rollout, a need to re-engage in social activity, declining trust in government, and other personal stresses. These trends tell us we can’t simply pull the same policy leavers and expect to achieve the same outcomes as those seen in March 2020.

There is further variation in our findings when we look at different areas. In general, we observed lower levels of household visitation in rural areas, while some cities (London, Manchester and Cambridge, for example) regularly exceeded pre-COVID activity levels.

The reason for these differences is not clear. It could be linked to factors like household composition and personal circumstances, but further work is needed to better understand the complex demographic and household factors influencing these trends.

The implications

While there are some intriguing patterns of activity in this data, we must also apply plenty of caution in drawing conclusions. We can only speculate on the causes underlying the trends we observe, and the trends we see in England don’t necessarily reflect what has happened, or might happen, elsewhere.

Nevertheless, these findings add to our understanding of the impacts of pandemic policy, and highlight the need for nuance in crafting future interventions.

The patterns of household visitation we observed reflect the social complexities of the pandemic period. We must remember that household visitation does not equate to malicious noncompliance, and instead may point to the need for people to see each other for their emotional wellbeing.

While there are clear public health reasons to encourage caution in social mixing, this must be balanced against the negative outcomes of lockdowns and their potentially diminishing returns. Policy must be crafted to account for these nuances – supporting opportunities to socialise while avoiding higher risk interactions, responding locally, and adapting with the changing attitudes and circumstances faced by the population.


Ed Manley, Professor of Urban Analytics, University of Leeds and Mengdie Zhuang, Lecturer in Data Science, University of Sheffield

This article is republished from The Conversation under a Creative Commons license. Read the original article.

Masters Dissertation Scheme 2021 Awards

Data shown in gold converging into a point of light on the horizon like a sunset

Masters Dissertation Scheme 2021 Awards

Since 2012, the nationwide CDRC Masters Dissertation Scheme (MDS) has brought together masters students intent upon pursuing dissertations using retail and other industry data, their academic supervisors and industry contacts who are able to provide data or support ‘horizon-scanning’ research focused upon real world problems. The MDS now also has an active alumni network of past students to maintain and further develop industry collaborations with CDRC.

Every year, the best dissertations are showcased at an event and three prizes awarded to the best dissertations.

This year’s awards ceremony was held online, hosted by the Market Research Society’s Census and GeoDems Group, with prizes awarded by the Economic and Social Research Council’s Senior Policy Manager, Bruce Jackson.

The winner was Disa Ramadhina (MSc Business Analytics, UCL) who worked with partner Entain Group on the relationship between the use of retail shop and online gambling behaviour. Disa now works with Entain Group as a Compliance Data Analyst in their Safer Gambling team.  

Runner up Sharon Liu (MSc Operational Research with Data Science, University of Edinburgh) worked with longstanding MDS partner Walgreen Boots Alliance on enhancements to online recommender systems to personalise customer experience.

Movement Strategies has also become a regular sponsor of MDS projects and worked with our other runner up, Lu Xia (MSc Social and Geographic Data Science, UCL) on inferring transport mode using GPS data.

Disa Ramadhina

Sharon Liu
Sharon Liu

Lu Xia
Lu Xia

Our warmest congratulations to these very worthy winners, who share £1,000 in prize money. This year the MDS attracted 80 applications for the 20 projects on offer, details of which can be found in the MDS Project Archive

The Masters Dissertation Scheme 2022 is now open for proposals from industry and other partners – enquiries can be directed to Melanie Chesnokov at m.chesnokov@ucl.ac.uk

First Findings From IGD Research Trials Announced

Bowl of delicious looking fruit

First Findings From IGD Research Trials Announced

The research results from the first of our behaviour change trials working with the Institute of Grocery Distribution have been announced this week!  Further blogs from members of the team involved will follow in the next few weeks…

IGD press release

Collaboration between IGD, food and consumer goods industry and the University of Leeds helps shift people towards healthier, more sustainable diets

As part of its ambition to make healthy and sustainable diets easy for everyone, IGD is today launching the first results from its in-store behaviour change trials, testing what strategies at point of sale could shift consumers towards making healthier, more sustainable food and drink choices.

To find out what truly drives long-term behaviour change, IGD has joined forces with leading retailers, manufacturers and researchers at the University of Leeds, to put theory into practice with millions of people through a series of real-life behaviour change trials. These first results were taken from promotions across 101 Sainsbury’s stores during a four-week-period in both January 2020 and January 2021.

With 37% of consumers saying that cost prevents them from eating a healthy, sustainable diet1 , the trials tested the hypothesis: reducing the price of fruit and vegetables to 60p in stores across the country, for four weeks, should increase portions sold and variety of products purchased2 using three behaviour change levers. Sales data analysed by the team at The University of Leeds found the number of promoted fruit and vegetable portions sold increased by 78% when the price was reduced.

Susan Barratt, IGD CEO, said: “Obesity is one of the biggest health problems this country faces. Just 1% of the UK population currently meets government healthy eating guidance.3 With our diets having such a huge impact on our health and our planet, now is the time for government, the food and consumer goods industry and shoppers to take collective action. The most impactful way to make a difference is to change what we eat and drink.

“This report explores our initial findings, which already shows a positive impact through nudge tactics, pricing and product placement. This is a hugely exciting project, demonstrating the genuine opportunity our industry has to make healthy and sustainable diets easier and more accessible for everyone.”

As well as the number of promoted fruit or vegetables purchased, fruit and vegetable sales also increased beyond the items on offer. The findings show that promoted fruit and vegetable sales did decline after the promotions ended, although the rate of decline reduced year-on-year, suggesting some consumers carried their healthier eating habits forward.

Further findings from Sainsbury’s – looking at whether consumers continued to eat a greater variety of fruit and vegetables in the year after the trial – will be reported on in 2022.

IGD is leading the way and bringing industry together to collaboratively drive change by implementing the trials, with support from their research partner, the University of Leeds, through its Leeds Institute for Data Analytics (LIDA) and Consumer Data Research Centre (CDRC). LIDA is capturing and measuring sales data from each intervention to assess what levers drive long-term behaviour change to adopting healthier and more sustainable food and drink choices. With learnings from these and further trials that are underway with several UK retailers, which will be shared in 2022, IGD will recommend how industry can effectively shift consumer behaviour towards healthy and sustainable diets.

Dr Michelle Morris, who leads the Nutrition and Lifestyle Analytics team at LIDA/CDRC, said: “Using anonymous sales data at scale, over an extended period of time to understand consumer behaviours and evaluate interventions, is unique and exciting. The collaborative approach to study design, independent analysis and wide dissemination strategy means that we can share learnings across the sector to make the best changes to help consumers purchase healthier and more sustainable choices.”

Use this report to understand how, by working together, the food and consumer goods industry can drive change and trial real-life solutions to inspire others. As part of this work, IGD has also developed a hub of inspiring industry insight, bringing together a wealth of resources to help deliver change in your organisation. Visit the hub to find out why healthy, sustainable diets should be central to your business strategy and see how you can get involved.

For media enquiries please contact Sarah Burns sarah.burns@igd.com / t: 07483 094027.

  1. IGD (2021), Appetite for Change
  2. IGD, Healthy Sustainable Diets: Driving Change, Behavioural Insights Report 2021 – An adult portion of fruit and vegetables is 80g, according to Government guidance
  3. https://bmjopen.bmj.com/content/10/8/e037554

Measuring Ambient Populations during COVID-19 (Case Study)

Graph showing footfall data results

Measuring Ambient Populations during COVID-19 in Leeds City Centre
(Case Study)

The COVID-19 pandemic led to lockdowns being implemented all over the world, including in the UK.  The aims of the project were to investigate relevant data sources for modelling the ambient population of Leeds City Centre during COVID-19 and analysing the impacts that lockdown policies had on urban footfall.  The research builds on previous work undertaken with Leeds City Council by intersecting key dates from the English lockdowns and integrating these into machine learning models to assess the importance of different aspects of lockdowns. It also predicts what “business as usual” may have been like had there been no pandemic.

Analysis notebooks and scripts can be accessed at https://github.com/tbalbone31

Data and methods

Leeds City Council have been collecting footfall data for more than a decade. The data were wrangled and aggregated to create a history going back to 2008.  These data were then analysed alongside key lockdown dates to determine where trends in urban footfall intersected, raising questions about what aspects of these policies might have had the most impact.  The data cover a relatively small geographical area of Leeds City Centre and only reflect pedestrian traffic going past the locations identified by the cameras.  There are issues with data quality, such as potential double counting, periods of time with missing data and inconsistent file formatting, however it covers a large temporal scale and many problems can be worked around.

Google COVID-19 Community Mobility data was analysed as a potential alternative data source to the Council data.  It shows changes in mobility from a baseline for six different destinations (see the website for more details).  The smallest relevant spatial coverage is the Leeds City Region.  This was considered too large to isolate any changes impacting the city centre, making comparison of trends difficult.

The Council footfall data were resampled to show daily counts on which analysis was then conducted.  Visual analysis was undertaken to identify footfall trends over the course of the pandemic against key dates pertaining to the implementation and lifting of certain COVID-19 restrictions. These key dates were decided from research into when major legislation came into force or government announcements about restrictions were made.  The questions generated from initial analysis were then explored by creating a series of machine learning models using Random Forest Regression in the Python SciKit Learn package. 

The first model included a series of input variables to represent different aspects of society that had restrictions placed on them alongside other external conditions (such as weather, school/bank holidays, day of week, etc).  Variable importance was used to identify what (if any) aspects of lockdown might be significant in predicting future changes in footfall. The second model omitted any lockdown related inputs and was designed to make predictions on what “business as usual” might have been like had the pandemic not happened. 

Due to the inherently ordered nature of time series data, both models were validated using a method known as “Walk-Forward Validation” instead of the default Cross-validation included in SciKit Learn and often used on Random Forest Ensembles.  The implementation of Walk-Forward validation allows the model to be retrained after every prediction on the validation dataset, essentially “walking forward” through the time series.  This avoids potential data leakage because of the randomised nature of Cross-validation.

Key findings

The chart below shows the resampled footfall data intersecting with key dates from COVID-19 restrictions.

Key dates are shown as a dotted line with a number relating to a key.  Red zones indicate “official” lockdowns whilst orange represents periods where a variety of restrictions were in place but in the process of being lifted/introduced individually.  A summary of how this impacted footfall is below:

  • Footfall started to drop immediately after the announcement on 16th March 2020, no official restrictions implemented.
  • After non-essential shops and schools reopened on 15th June 2020, footfall started to rise again.
  • Footfall continues to rise through summer until around 22nd September 2020 when some restrictions were announced.
  • Footfall rises whilst Leeds is in tier 2 and 3, potentially because gatherings are only permitted in public spaces.
  • The second and third lockdowns drive footfall back down again until restrictions begin to ease again in April 2021.

The first machine learning model was intended to explore whether any lockdown variables would be significant in predicting future changes in footfall.  Variable importance (top 10) is shown below.

The most important lockdown-related features were indoor entertainment and non-essential retail.  Whilst this is only an initial model and not a definitive conclusion, it does help indicate what aspects of lockdown might have impacted pedestrian traffic in the city centre more than others.

The second model was designed to test how useful the data would be in predicting what “business as usual” may have been like.

There was little difference between error scores across different numbers of trees, so a compromise of the best score and least processing power (500 trees) was chosen.  The model predictions using this hyperparameter are shown below.

Results from this initial model are by no means definitive, however the potential to quantify how much footfall has been lost exists.  For example:

  • Average daily footfall in the lead up to Christmas (taken as 30th November to 24th December 2020) was approximately 36% lower than predicted.
  • Average daily footfall over the school holidays was approximately 63% lower than predicted.
  • Approximate footfall loss for individual Bank Holidays was also calculated.  Most recorded over 90% lower than predicted values except for the August Bank Holiday which was around 22% lower.

Value of the research

Initial analysis has already been delivered to Leeds City Council.  An aggregated dataset of footfall camera data has been created and is available on the Consumer Data Research Centre (CDRC) Data Store for future research.  The initial models developed can be used and refined by future researchers and develop more accurate predictions, whilst more specific time series packages can be explored.

Insights

  • Urban footfall and ambient population was significantly impacted by COVID-19 lockdown policies (as was intended).
  • Closure of Indoor Entertainment and Non-Essential retail appear to be the most important lockdown-related factors in predicting footfall change.
  • Consideration must be given to how time series data is processed in classic machine learning models such as Random Forests.

Research theme

Urban analytics

People

Tom Albone – Data Scientist Intern (LIDA)

Dr Nick Malleson – Professor of Spatial Science

Professor Alison Heppenstall – Professor in Geocomputation

Dr Vikki Houlden – Lecturer in Urban Data Science

Dr Patricia Ternes – Research Fellow

Partners

Leeds City Council

Funders

Consumer Data Research Centre

Smartphone Apps and Activity – tracking trends in who, how and when we move

Someone doing up a shoelace and wearing a fitness tracker watch

Smartphone apps and activity – tracking trends in who, how and when we move

The advantages of being physically active have never been more apparent, with proven benefits across a wide range of health conditions. Traditionally, we might consider the beneficial role of physical activity to be in reducing obesity incidence and preventing non-communicable diseases, such as cardiovascular disease and type 2 diabetes. However, the COVID-19 pandemic has thrown further positives into the spotlight, as being physically active has been shown to reduce the risk of severe COVID-19 outcomes. Moreover, lockdowns and state-sanctioned time for exercise highlighted the importance of physical activity to mental health and wellbeing.

Physical inactivity is responsible for 1 in 6 deaths in the UK (equivalent to the risk from smoking1), with 1 in 3 men and 1 in 2 women not meeting the recommended 150 minutes of moderate to vigorous activity a week1. To reduce physical inactivity, we need to identify and remove the barriers to being active. These barriers are diverse and wide ranging, varying from person to person. Examples include, but are not limited to: increasingly sedentary occupations, time or monetary constraints and environments that do not support activity.

To best identify what and where these barriers to being active are, we need to establish a good understanding of where, when and how people are active. However, studies investigating physical activity behaviour are typically limited by sample sizes, small study areas and shorter study durations.

Increasingly, individuals are monitoring their own activity and fitness levels using smartphone apps or wearable trackers such as Fitbit, Garmin or smartwatches. Secondary use of these consumer data can provide researchers with new insights into physical activity behaviour. In this research, we use secondary app data provided by FUELL Ltd‘s Bounts app (available for use by researchers via application to the CDRC). We evaluate how useful secondary smartphone data are in providing insight into how active the public are. To do this, we first need to assess how representative app users are of the population as a whole. Finally we uncover key activity behaviours associated with different age and gender user profiles.

The app – who is using it?

The Bounts app was commercially available on all major app provider stores, with users earning points for activities which could later be exchanged for vouchers and prizes. All user data is pseudonymised and no identifiable user information is shared with the researchers. Additionally, data is only accessible to those with data security training and in a data secure environment.

We used the data of 30,804 app users who recorded seven or more days of activity in 2016. With an average user age of 39, women make up a significantly larger proportion of app users (77.7% of users). 43.8% of users provided a postcode district which we linked to the Office for National Statistics socioeconomic classification. Unlike traditional studies, which tend to underrepresent lower socio-economic groups, we found there was no substantial socioeconomic difference in the areas where Bounts users lived compared to the general population.

Research highlights

Seasonal and weekly trends in physical activity behaviour

Users recorded on average 218 days of activity, which is substantially longer than the typical seven-day data collection period in traditional physical activity studies. Thanks to this long monitoring period, we were able to observe distinct patterns in activity behaviour across weekly and seasonal timeframes.

Across the year, we can see the role daylight saving plays, with a higher number of activities recorded by users over the summer months when evenings are longer, dropping off in autumn as the days get shorter (Figure 1).

Figure 1 – Seasonal trend heatmap of total daily activity recorded by all app users
Figure 2 – Heatmap of total daily activity recorded by all app users standardised by week, highlighting weekly patterns of behaviour

We can also see a weekly pattern in activity behaviour with the highest number of activities recorded mid-week, peaking on Tuesdays (Figure 2). Higher weekday activity levels are suspected to be functional activity around commuting behaviours. This goes against the ‘weekend warrior’ theory that individuals tend to exercise more on the weekends and less on weekdays.

A higher level of functional activity is associated with women and those in less affluent socioeconomic groups. This corresponds to our user sample which has a high proportion of women and captures users from less affluent socioeconomic groups, who are usually underrepresented in physical activity studies.

Who is meeting the physical activity guidelines?

For each week that a user recorded activity, we calculated whether the culmination of this activity was enough to meet physical activity guidelines of 150 minutes of moderate to vigorous activity per week. This includes any activity with greater or equal intensity to brisk walking.

Despite the known health benefits, the overall proportion of weeks meeting these physical activity guidelines was low. The youngest and oldest users were the least likely to meet the guidelines, with those aged 35 to 44 most likely to meet the sufficiently active threshold.

Men were almost twice as likely to meet the guidelines, with 24.2% of weeks recorded by male users classed as adequately active compared to 12.4% of weeks recorded by female users. Additionally, living in the most affluent area compared to the least affluent (in terms of employment), improved the odds of recording an active week by almost 5%.

How useful are secondary smartphone data?

Secondary smartphone data are an invaluable tool to provide new insights into physical activity and other health behaviours, as they give a breadth and depth of detailed data not available from other methods.

On the flip side, using these data requires careful consideration, including meticulous implementation of data anonymity and ethics, attention to data handling and cleaning processes, and skilled training to be able to handle such a large detailed dataset. Used in tandem with more traditional primary data collection studies, secondary smartphone app data have the capability to address some of the most complex questions around physical activity behaviour.  We are still very much in the infancy of using these data and have just scratched the surface of their full potential.

Read the full paper: Pontin F, Lomax N, Clarke G, et al. Socio-demographic determinants of physical activity and app usage from smartphone data. Social Science & Medicine 2021: 114235.

References

1. Public Health England. Physical activity: applying All Our Health.  2019.

Being A Data Science Intern

Photo of Rosalind Martin outdoors wearing a blue coat and a scarf

Being A Data Science Intern – insights, challenges and benefits

Rosalind is one of the Leeds Institute for Data Analytics’s (LIDA) current Data Scientist Interns, with a background in Geography (BSc) and Geographical Information Systems (GIS MSc).

I’ve always been a fan of physical geography, but as module choices expanded throughout my degrees I was increasingly drawn to (spatial) data modules. I love using GIS and coding to solve big data challenges.

My internship has been made up of two six-month projects, both funded by the Consumer Data Research Centre (CDRC). My first project was titled ‘Isolation and Exclusion in a Social Distancing Covid World’. Here, I worked under the supervision of academics from the Universities of Newcastle and Leeds, aiming to identify people and households at risk of isolation and exclusion as a result of Covid lockdown rules.

Photo of Rosalind Martin outdoors wearing a blue coat and a scarf

My second project is in the world of nutrition where I’m working closely with Leeds academics, Dr Michelle Morris and Vicki Jenneson, and a retail partner. I am designing an open access tool which will assist retailers in implementing new policy restricting the promotion of foods that are high in fat, salt and sugar – a crucial part of reducing obesity in the UK.

What has been my experience of the LIDA Internship Programme?

Aerial view of desk with hands over a laptop keyboard, pot plant, glasses and pen

As I’m sure many people would echo, the Covid pandemic has placed our jobs in unfamiliar situations. The reality of this internship being my first full-time post means that I’ve not been comparing my days to ways I have worked in the past. Instead, my experience has been shaped by remote team working with virtual training, coffee breaks and meetings. Although working from home (WFH) comes with its own challenges and complexities, I believe this has given me the capacity to be thankful to work on engaging projects rather than pining for something I used to have!

Due to the pandemic, many interns have been able to experience otherwise inaccessible conferences and workshops as they’ve transitioned online. I’ve been to events held by The Alan Turing Institute, the Royal Society, CDRC and more! Working as a remote cohort, the interns have set up coffee breaks and a weekly “pub” session to replicate those water-cooler conversations, lost due to WFH. This space allows us to talk about our projects, seek help from others who have different skillsets and to simply get to know each other.

What have I been proud to have accomplished so far on the internship?

Coding while WFH has been a true test of my perseverance. In the absence of spinning my chair around to ask for a fresh pair of eyes, I’ve really had to learn how to use documentation and online forums to navigate my coding challenges. I’ve also learnt how best to send questions (with reproducible examples) to other interns or my supervisors. I’ve seen a visible increase in my confidence and ability between my first and second projects, and I know this skill will continue to serve me in future careers. 

What are my quick hacks for getting the most out of the internship?

  • Obtaining data always takes longer than you think: be proactive in learning methods, using dummy data and reading around the subject while you wait
  • Talk to the interns: each intern has a different background and therefore their own unique combination of skills. Ask questions and be ready to offer your own experiences if asked
  • Write detailed descriptions of your GitHub commits: your future self will thank you when you return from Annual Leave to find you have a detailed record of what you were working on before you left for your holiday

How has working with the Consumer Data Research Centre (CDRC) helped with the delivery of my first project?

My first intern project aimed to identify those at risk of isolation and exclusion under Covid lockdown rules. In order to make detailed predictions of impacted individuals and households, I worked with a micro-simulated synthetic population called SPENSER. This CDRC and Alan Turing Institute funded project was essential for me to make predications at the household level. I also used other datasets to support my work including CDRC’s Access to Healthy Assets and Hazards dataset. The availability of these datasets enabled me to explore the Covid restrictions that were thought to negatively impact an individual’s risk of isolation.

How will this Internship help me progress my career in data science?

I have learnt more of the mechanics of data access throughout both of my projects – ranging from obtaining freely-available through to applying for safeguarded datasets (including how long the process can sometimes take!). In my projects, I have had the opportunity to talk to the City Council, UK and international universities, not-for-profit organisations and retailers. Speaking to people in a wide range of data roles has helped me to better understand the opportunities available in data science, and how roles interact with non-data scientists. 

Why would I recommend the LIDA Data Science Internship?

The LIDA Data Science Internship has given me the opportunity to own the delivery of two data science projects situated in very different subject areas. This has really expanded my understanding of how data can be used to solve very complex but nationally topical challenges. Owning the delivery of the projects as someone straight out of their Master’s has been a challenge, but I have been well supported by experienced supervisors and the extended LIDA network. With the breadth of internship projects and collaborators available across and in partnership with LIDA, the internship is the place to be!

LIDA is currently recruiting for its next cohort of Data Scientist Interns, due to start at the end of September 2021, with several projects taking place within the CDRC. Click here for more information and to apply.

Celebrating collaboration: the CDRC Masters Dissertation Scheme

Celebrating collaboration: the CDRC Masters Dissertation Scheme

Celebrating collaboration: the CDRC Masters Dissertation Scheme. Thursday 29th April 2021, 10:30-15:00.

The CDRC Masters Dissertation Scheme, now in its tenth year, has been successfully run by the Consumer Data Research Centre for the last seven years. The event celebrated the success of the scheme, and explored the changing nature of academic-industry collaboration. Masters students who had gone through the scheme presented project case studies, and a selection of alumni spoke of the positive impact the scheme had had on their data science careers. A panel session rounded off the event with a discussion of the possibilities and ambitions for the next seven years of the Masters Dissertation Scheme. The event was attended by industry partners, MDS alumni, and the CDRC team including Paul Longley, Alex Singleton, and Jonathan Reynolds.

Speaker biographies

Programme

1030-1130: The Business of Engagement. Session recording (Longley 0:06, Dugmore 7:05, Reynolds 28:27, Squires 41:21)

  • Introduction & welcome: Professor Paul Longley, Director, CDRC
  • The evolution of academic-industry collaboration: Keith Dugmore, Demographic Decisions. Slides
  • CDRC: Where are they now? MDS 7 years on: Dr Jonathan Reynolds, Deputy Director (Oxford), CDRC. Slides
  • The business of engagement: the firm’s perspective: Martin Squires, Director of Advanced Analytics, Pets at Home. Slides

1145-1245: Alumni presentations. Session recording (Murage 2:16, Davies 25:10, Tonge & Montt 45:53)

  • Nombuyiselo Murage, Tamoco. Dissertation at Tamoco. MSc Geographic Data Science, University of Liverpool. Slides
  • Alec Davies, Pets at Home. Dissertation at Sainsbury’s. MSc Geographic Data Science, University of Liverpool, PhD Geographic Data Science. Slides
  • Christian Tonge, Movement Strategies. MSc Geographic Data Science, University of Liverpool, and Cristobal Montt, Movement Strategies. MSc Data Science, City, University of London. Dissertations at Movement Strategies. Slides

1400-1505: Alumni presentations (continued) and panel discussion. Session recording (Ushakova 1:48, Samson 21:29, Panel 37:26)

  • Alumni presentation: Dr Anastasia Ushakova, Senior Research Associate, University of Lancaster. Dissertation at British Gas.
    MSc Public Policy, UCL; PhD Computational Social Science. Slides
  • Alumni presentation: Nick Samson, Associate Director, CBRE. Dissertation at British Gas. MSc Geographic Information Science, UCL. Slides
  • Panel Discussion. The next 7 years. Achievements and ambitions: Alex Singleton, Deputy Director (Liverpool), CDRC;
    Samantha Hughes, Analytics Innovation Manager, Avon; Martin Squires, Director of Advanced Analytics, Pets at Home.
  • Thanks & conclusion: Professor Paul Longley, Director, CDRC

Nick Samson, 2014 MDS alumnus. Dissertation at British Gas. Project title: Can smart meters save consumers and British Gas money and carbon by pinpointing which consumers are most likely and best placed to install insulation in their homes?