When the COVID-19 pandemic struck, already strained Local Authority resources were stretched even further, with infection and transmission of the virus exacerbating existing social inequalities.
In order to support the response of local authorities, groups and stakeholders to COVID-19, the Local Data Spaces (LDS) project was set up – a collaboration between the Consumer Data Research Centre (CDRC), the Joint Biosecurity Centre (JBC), the Office for National Statistics (ONS) and ADR UK.
What did the project involve?
During the six-month project, our research team engaged with 25 local authorities to better understand local priorities, contexts and research needs. From the meetings with local stakeholders, the huge variation in resources available for research and analytical capacity became clear.
Two core research priorities were identified which focused on broader COVID-19 health impacts and inequalities, and economic vulnerability and recovery potential.
With local authorities working alongside the research team, we developed relevant and useful reports and helped fill evidence gaps at local levels. Using data from the ONS’s Secured Research Service (SRS), we generated a series of ten reports, specific to each local area, investigating themes including demographic and ethnic inequalities in COVID-19, excess mortality, economic vulnerabilities and human mobility.
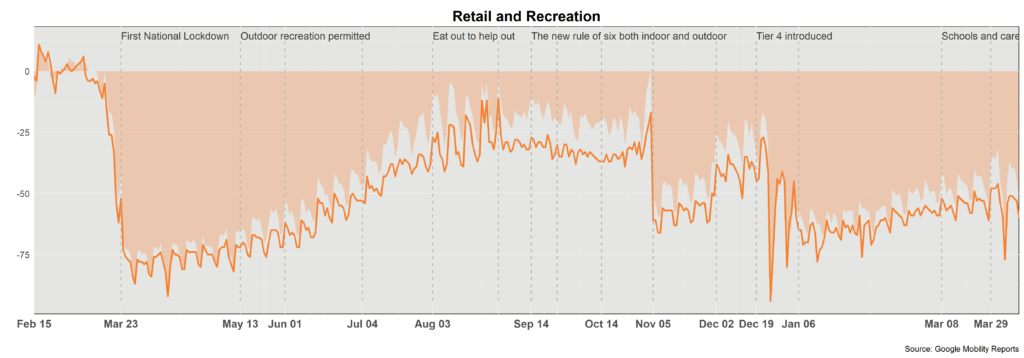
One report output, comparing changes in retail and recreation over time for the country (area) and local authority (line).
What data was used?
The ONS’s Secured Research Service includes core national data products such as NHS Test and Trace, the COVID-19 Infection Survey, the Business Structure Dataset (BSD) registry and the Business Registry and Employment Survey (BRES). These data sources were supplemented where relevant with openly available datasets such as the ONS Population Estimates, Google Mobility Data, and CDRC open data products such as the CDRC Business Census, and Access to Healthy Assets and Hazards (AHAH).
How does this project help?
Apart from profoundly important data analysis, the reports provide a number of practical efficiencies with all of the processes required to prepare datasets already completed – vital if local authorities do not have the analytical resources or time to undertake the work themselves. The reports also allow access to high-quality datasets that they may not have access to otherwise.
Through the series of reports for each local authority, we sought to paint a picture of the impacts of the pandemic, and also provide regional and national level comparisons where possible to highlight the relative local level impact. Local authorities are now quickly and succinctly able to uncover the local impact COVID-19 has had across a range of health, human mobility and economic themes in their own regions.
Smartphone apps and activity – tracking trends in who, how and when we move
The advantages of being physically active have never been more apparent, with proven benefits across a wide range of health conditions. Traditionally, we might consider the beneficial role of physical activity to be in reducing obesity incidence and preventing non-communicable diseases, such as cardiovascular disease and type 2 diabetes. However, the COVID-19 pandemic has thrown further positives into the spotlight, as being physically active has been shown to reduce the risk of severe COVID-19 outcomes. Moreover, lockdowns and state-sanctioned time for exercise highlighted the importance of physical activity to mental health and wellbeing.
Physical inactivity is responsible for 1 in 6 deaths in the UK (equivalent to the risk from smoking1), with 1 in 3 men and 1 in 2 women not meeting the recommended 150 minutes of moderate to vigorous activity a week1. To reduce physical inactivity, we need to identify and remove the barriers to being active. These barriers are diverse and wide ranging, varying from person to person. Examples include, but are not limited to: increasingly sedentary occupations, time or monetary constraints and environments that do not support activity.
To best identify what and where these barriers to being active are, we need to establish a good understanding of where, when and how people are active. However, studies investigating physical activity behaviour are typically limited by sample sizes, small study areas and shorter study durations.
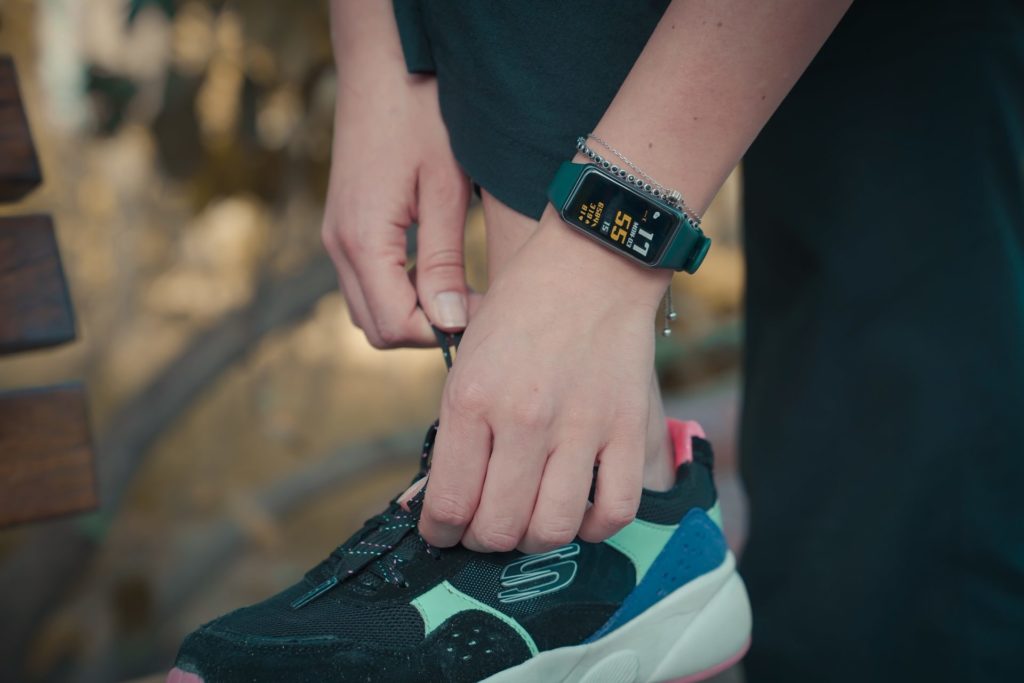
Increasingly, individuals are monitoring their own activity and fitness levels using smartphone apps or wearable trackers such as Fitbit, Garmin or smartwatches. Secondary use of these consumer data can provide researchers with new insights into physical activity behaviour. In this research, we use secondary app data provided by FUELL Ltd‘s Bounts app (available for use by researchers via application to the CDRC). We evaluate how useful secondary smartphone data are in providing insight into how active the public are. To do this, we first need to assess how representative app users are of the population as a whole. Finally we uncover key activity behaviours associated with different age and gender user profiles.
The app – who is using it?
The Bounts app was commercially available on all major app provider stores, with users earning points for activities which could later be exchanged for vouchers and prizes. All user data is pseudonymised and no identifiable user information is shared with the researchers. Additionally, data is only accessible to those with data security training and in a data secure environment.
We used the data of 30,804 app users who recorded seven or more days of activity in 2016. With an average user age of 39, women make up a significantly larger proportion of app users (77.7% of users). 43.8% of users provided a postcode district which we linked to the Office for National Statistics socioeconomic classification. Unlike traditional studies, which tend to underrepresent lower socio-economic groups, we found there was no substantial socioeconomic difference in the areas where Bounts users lived compared to the general population.
Research highlights
Seasonal and weekly trends in physical activity behaviour
Users recorded on average 218 days of activity, which is substantially longer than the typical seven-day data collection period in traditional physical activity studies. Thanks to this long monitoring period, we were able to observe distinct patterns in activity behaviour across weekly and seasonal timeframes.
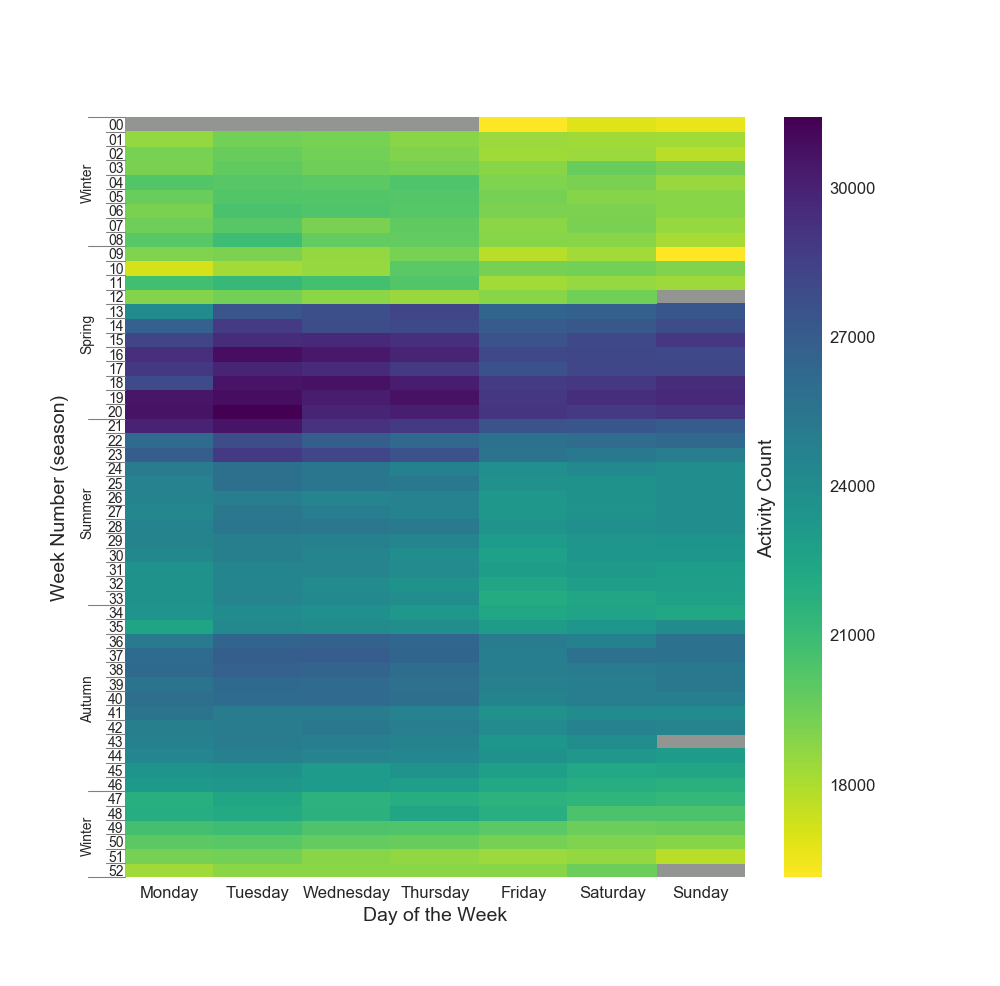
Across the year, we can see the role daylight saving plays, with a higher number of activities recorded by users over the summer months when evenings are longer, dropping off in autumn as the days get shorter (Figure 1).
Figure 1 – Seasonal trend heatmap of total daily activity recorded by all app users
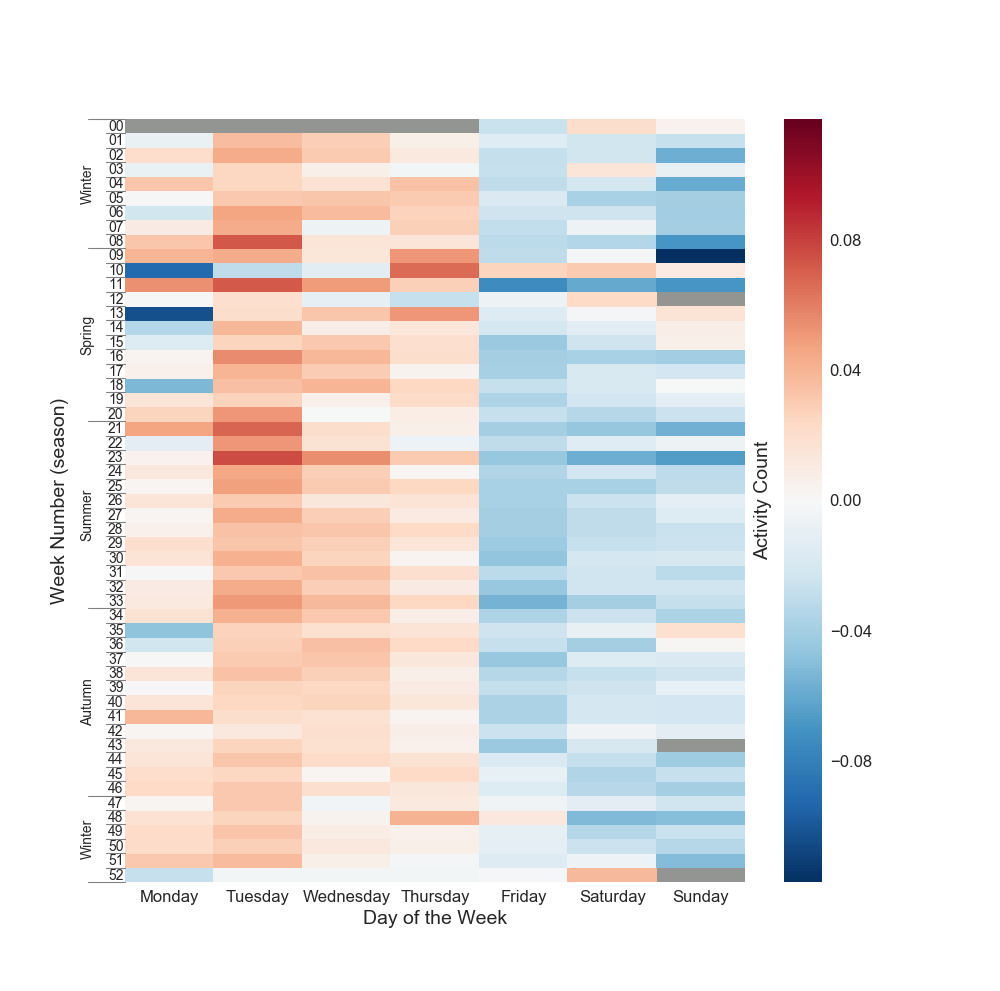
Figure 2 – Heatmap of total daily activity recorded by all app users standardised by week, highlighting weekly patterns of behaviour
We can also see a weekly pattern in activity behaviour with the highest number of activities recorded mid-week, peaking on Tuesdays (Figure 2). Higher weekday activity levels are suspected to be functional activity around commuting behaviours. This goes against the ‘weekend warrior’ theory that individuals tend to exercise more on the weekends and less on weekdays.
A higher level of functional activity is associated with women and those in less affluent socioeconomic groups. This corresponds to our user sample which has a high proportion of women and captures users from less affluent socioeconomic groups, who are usually underrepresented in physical activity studies.
Who is meeting the physical activity guidelines?
For each week that a user recorded activity, we calculated whether the culmination of this activity was enough to meet physical activity guidelines of 150 minutes of moderate to vigorous activity per week. This includes any activity with greater or equal intensity to brisk walking.
Despite the known health benefits, the overall proportion of weeks meeting these physical activity guidelines was low. The youngest and oldest users were the least likely to meet the guidelines, with those aged 35 to 44 most likely to meet the sufficiently active threshold.
Men were almost twice as likely to meet the guidelines, with 24.2% of weeks recorded by male users classed as adequately active compared to 12.4% of weeks recorded by female users. Additionally, living in the most affluent area compared to the least affluent (in terms of employment), improved the odds of recording an active week by almost 5%.
How useful are secondary smartphone data?
Secondary smartphone data are an invaluable tool to provide new insights into physical activity and other health behaviours, as they give a breadth and depth of detailed data not available from other methods.
On the flip side, using these data requires careful consideration, including meticulous implementation of data anonymity and ethics, attention to data handling and cleaning processes, and skilled training to be able to handle such a large detailed dataset. Used in tandem with more traditional primary data collection studies, secondary smartphone app data have the capability to address some of the most complex questions around physical activity behaviour. We are still very much in the infancy of using these data and have just scratched the surface of their full potential.
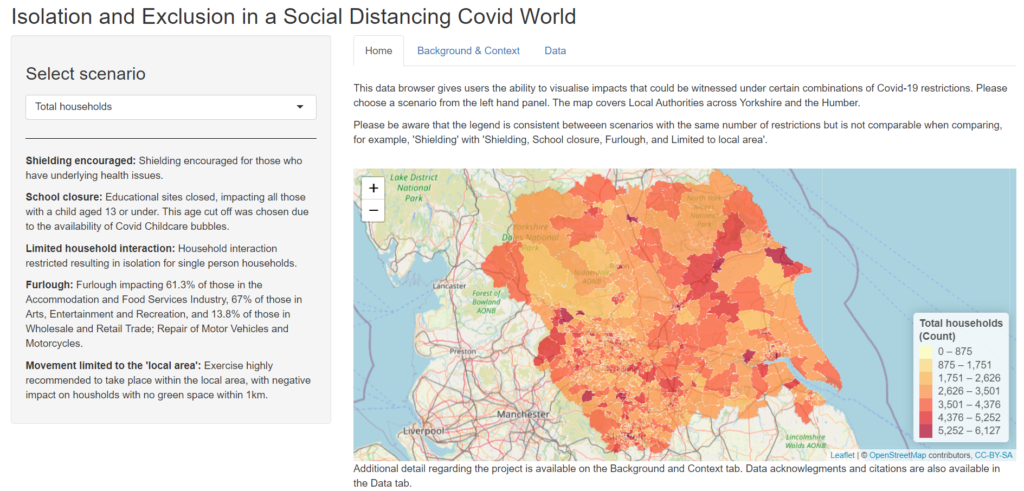
Isolation and Exclusion in a Social Distancing COVID-19 World (Case Study)
CDRC Data Scientist Intern, Rosalind Martin, working with Professor Susan Grant-Muller, Professor Alison Heppenstall and Dr Vikki Houlden from the University of Leeds, and Professor Rachel Franklin from the University of Newcastle, has produced a dashboard that identifies geographical areas which might experience increased isolation and exclusion as we leave the COVID-19 pandemic and lockdowns.
Project overview
Although much work has already been completed which identifies individuals most at risk from health impacts of the COVID-19 pandemic, there is considerable uncertainty regarding which societal impacts will persist as the UK leaves COVID-19 lockdowns. This project was undertaken with the aim of advancing the understanding of the social and spatial impacts of emergence from lockdown, particularly understanding how previously implemented restrictions will have impacted individuals and households. Using SPENSER, a synthetic population, we have identified individuals and households at risk from five COVID-19 restrictions: shielding, school closures, limited household interaction, furlough and limited to local area, along with households at risk from unique combinations of these five scenarios. This has been translated onto a dashboard which displays additive counts of household level impacts at the Middle Layer Super Output Area (MSOA) level.
Data and methods
We applied five COVID-19 restrictions (that cover a breadth of socio-economic impacts) to individuals and households across Yorkshire and the Humber. Our population came from SPENSER, a synthetic micro-population, along with additional characteristics obtained from supplementary datasets. The criteria for an individual or household to be impacted by each restriction were influenced by external statistics and are as follows:
Shielding: a randomly extracted 4.83% of the population who had been classified as in poor health, based on answering that their day-to-day activities were limited a lot due to a long-term health problem or disability in the 2011 census. The ailing population is representative of MSOA level trends and split into four age categories (0-15, 16-49, 50-64 and 65 and over).
School closure: households with at least one child aged 13 or under. This age was chosen as it is the age cut-off for forming a COVID-19 ‘childcare bubble’.
Limited household interaction: all single-person households as determined by a household size of one (a pre-existing characteristic in the SPENSER data).
Furlough: the proportion of individuals working in (1) Accommodation and food service activities, (2) Arts, entertainment and recreation, and other service activities and (3) Wholesale and retail trade, repair of motor vehicles and motorcycles industries, were identified at the MSOA level from 2011 census data and replicated proportionally in our SPENSER population. The average percentage of furloughed employees was then identified. These were 61.3%, 67% and 13.8% respectively.
Limited to local area: all households who live in an MSOA where there is no accessible green space within 1km. These data were from CDRC’s Access to Healthy Assets and Hazards dataset.
Once all the restrictions had been applied to the households, each household was assigned to a scenario which represented a unique combination of all of the five restrictions. There were 32 scenarios in total. This enabled additive counts of impacts on households to be calculated. These final outputs are displayed on the accompanying dashboard. Counts of household impacts are displayed alongside total household counts for each MSOA and Indices of Economic Insecurity, produced by Smith et al. (2020) and used with permission.
Front page of the Isolation and Exclusion dashboard
Key findings
This project has resulted in the development of an interactive dashboard, showing counts of household-level impacts at the MSOA level for Yorkshire and the Humber. Although patterns of household-level impacts are difficult to see from these maps, this work has explored how to use proxy data in order to identify individual- and household-level impacts from COVID-19 restrictions, and begun to unpack the complexities of combining data at the household level. This is something that must continue going forward as academics and policy makers continue to face the challenges that accompany understanding the social and spatial impacts of the emergence from lockdown.
Through this work, it has become apparent that certain COVID-19 specific datasets do not exist yet (such as the uptake of ‘support bubbles’) so assumptions have to be made on the extent of impacts. This detail should be added in to future tools when possible. Where data do exist, they are often lacking spatial resolution and so it has to be assumed that patterns have coarse geographies. This detail should be added in to future predictions when possible. Going forward, work must utilise more specific and detailed datasets.
The use of SPENSER as a micro-population has been foundational to understanding the impact of restrictions on individuals and households. It is recommended that any work going forward on this matter also uses small area population data as without it, any patterns of social and spatial impacts of emergence from lockdown will be coarse from the start.
Value of the research
The COVID-19 pandemic, with its associated lockdowns and restrictions, has brought vast change to the routines of families across the world. This work has had a small part in deciphering what these changes could mean for those across Yorkshire and the Humber. Dashboards with mapping have shown to be an important tool for understanding how health impacts of COVID-19 are distributed, this same logic applies to how lockdown restrictions combine spatially.
COVID-19 causes health, social and economic impacts
Creation of a dashboard that displays different flavours of lockdowns
Supports pre-existing conclusions regarding the impact of COVID-19 lockdowns
Interrogation of complex layers of information aids policy reform
Current data are insufficient to capture COVID-19 lockdown impacts
Research themes
Urban Analytics
COVID-19
Spatial Inequality
Interactive Visualisation
People
Rosalind Martin, Data Scientist Intern at LIDA/CDRC
Professor Rachel Franklin, Professor of Geographical Analysis at the University of Newcastle
Professor Susan Grant-Muller, Chair in Technologies and Informatics at the University of Leeds
Professor Alison Heppenstall, Professor in Geocomputation at the University of Leeds
Dr Vikki Houlden, Lecturer in Urban Data Science at the University of Leeds
Partners
Consumer Data Research Centre (CDRC)
Funders
This project was funded by the Consumer Data Research Centre.
Funding for SPENSER is provided by The Alan Turing Institute, project reference R-LEE-004.
References
Smith, D., Moon, G. and Roderick, P. 2020. Indices of Economic Insecurity: Version 2, August 2020. GeoData Institute, University of Southampton. [Online]. [Accessed 18th March 2020. Available from: https://www.mylocalmap.org.uk/iaahealth/
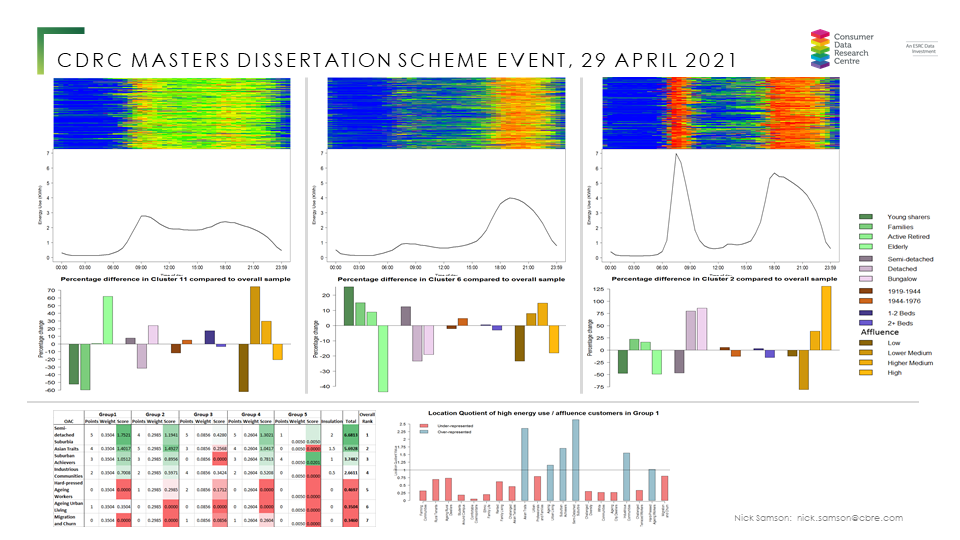
Celebrating collaboration: the CDRC Masters Dissertation Scheme
Celebrating collaboration: the CDRC Masters Dissertation Scheme. Thursday 29th April 2021, 10:30-15:00.
The CDRC Masters Dissertation Scheme, now in its tenth year, has been successfully run by the Consumer Data Research Centre for the last seven years. The event celebrated the success of the scheme, and explored the changing nature of academic-industry collaboration. Masters students who had gone through the scheme presented project case studies, and a selection of alumni spoke of the positive impact the scheme had had on their data science careers. A panel session rounded off the event with a discussion of the possibilities and ambitions for the next seven years of the Masters Dissertation Scheme. The event was attended by industry partners, MDS alumni, and the CDRC team including Paul Longley, Alex Singleton, and Jonathan Reynolds.
Nombuyiselo Murage, Tamoco. Dissertation at Tamoco. MSc Geographic Data Science, University of Liverpool. Slides
Alec Davies, Pets at Home. Dissertation at Sainsbury’s. MSc Geographic Data Science, University of Liverpool, PhD Geographic Data Science. Slides
Christian Tonge, Movement Strategies. MSc Geographic Data Science, University of Liverpool, and Cristobal Montt, Movement Strategies. MSc Data Science, City, University of London. Dissertations at Movement Strategies. Slides
Alumni presentation: Dr Anastasia Ushakova, Senior Research Associate, University of Lancaster. Dissertation at British Gas. MSc Public Policy, UCL; PhD Computational Social Science. Slides
Alumni presentation: Nick Samson, Associate Director, CBRE. Dissertation at British Gas. MSc Geographic Information Science, UCL. Slides
Panel Discussion. The next 7 years. Achievements and ambitions: Alex Singleton, Deputy Director (Liverpool), CDRC; Samantha Hughes, Analytics Innovation Manager, Avon; Martin Squires, Director of Advanced Analytics, Pets at Home.
Thanks & conclusion: Professor Paul Longley, Director, CDRC
Nick Samson, 2014 MDS alumnus. Dissertation at British Gas. Project title: Can smart meters save consumers and British Gas money and carbon by pinpointing which consumers are most likely and best placed to install insulation in their homes?
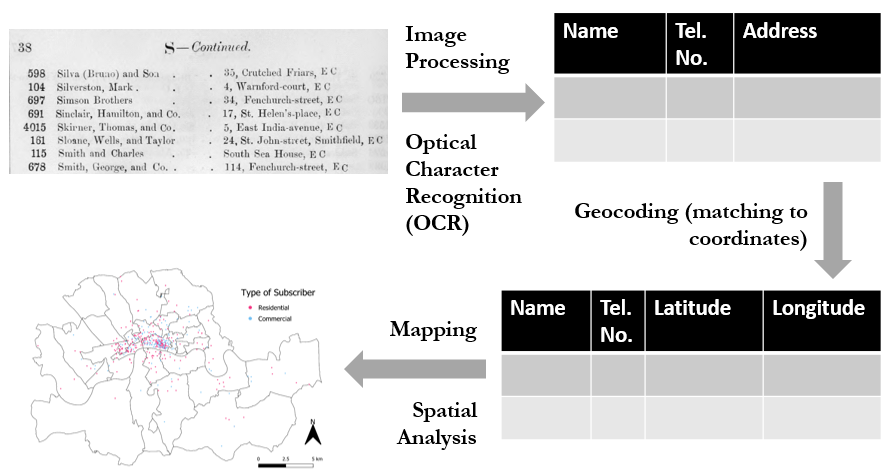
Digitising Historical Telephone Directories with BT Archives: GISRUK Best Short Paper Award 2021
CDRC collaborative PhD student, Nikki Tanu, and Senior Research Fellow, Dr. Maurizio Gibin, were awarded the ‘Best Short Paper’ award at the 2021 GIS Research UK (GISRUK) online conference on 16 April 2021. Their paper, ‘Georeferencing historical telephone directories to understand innovation diffusion and social change’, described pioneering work in the digital capture and georeferencing of the 1881 telephone directory. The work demonstrates proof of concept that will be rolled out to digitise selected directories up to the 1980s and will make it possible to chart the spatial and social diffusion and use of fixed line telephony in the 19th and 20th centuries.
Process of optical character recognition and geocoding used on the telephone directories