Professor Alex Singleton wins Royal Geographical Society award
Alex Singleton, CDRC Deputy Director and Professor of Geographic Information Science at the University of Liverpool, has received the Royal Society of Geography’s Cuthbert Peek Award for “contributions to contemporary methods in geography that lie at the boundary between the social and computational sciences”.
Professor Singleton will be presented with his award by the Royal Geographic Society’s President at their annual Medals and Awards ceremony on Friday 6th June.
The Cuthbert Peek Award recognises “those advancing geographical knowledge of human impact on the environment through the application of contemporary methods, including those of earth observation and mapping”.
Professor Singleton is an internationally recognised researcher in the field of geographic data science and urban analytics and has published widely on the subject including the seminal text book “Urban Analytics”. As well as being Deputy Director of the CDRC, he is also Director of the ESRC Data Analytics & Society CDT.
He said: “It is a great honour to receive this award in recognition of the work that my colleagues and I have been able to achieve at the University of Liverpool over the past decade. It is important that Geography remains outward looking, both so that we can benefit from those new technologies and methodologies developed elsewhere, but also to promote greater spatial thinking or engagement outside of the discipline.
“The intersection between Geography and the Computational Sciences provides an incredibly fruitful area of employment for our graduates, where there is significant demand for well-trained students who can apply their technical skills alongside critical thinking and wider situational awareness instilled through their variegated geography education.”
The Royal Geographical Society (with IBG) is the world’s largest Learned Society in Geography, with nearly 15,000 fellows around the globe. This year, their awards recognise 23 different people or organisations for their outstanding contributions to geography. The full list of recipients is available on their website.
Sir Cuthbert Edgar Peek (30 January 1855 – 6 July 1901) was an astronomer and meteorologist, and took part in activities of several learned societies alongside undertaking scientific expeditions to Iceland and Australia.
Last year, a successful Turing-LIDA Data Study Group took place – an intensive two-week hackathon with 62 researchers, at different stages of their careers and from a number of different countries, rising to one of six challenges set by different organisations. Some amazing research was done in a very short time, and five of the six reports into their findings have now been published:
Data Study Groups are a perfect opportunity for organisations (Challenge Owners) to test questions/problems quickly and with minimal resource, gaining insight into potential ways to further develop those areas of research. They also give researchers, at all stages of their careers, the chance to collaborate with others from different institutions and different disciplines, and apply their knowledge to real-world problems. For more information, visit The Alan Turing Institute’s Data Study Groups page.
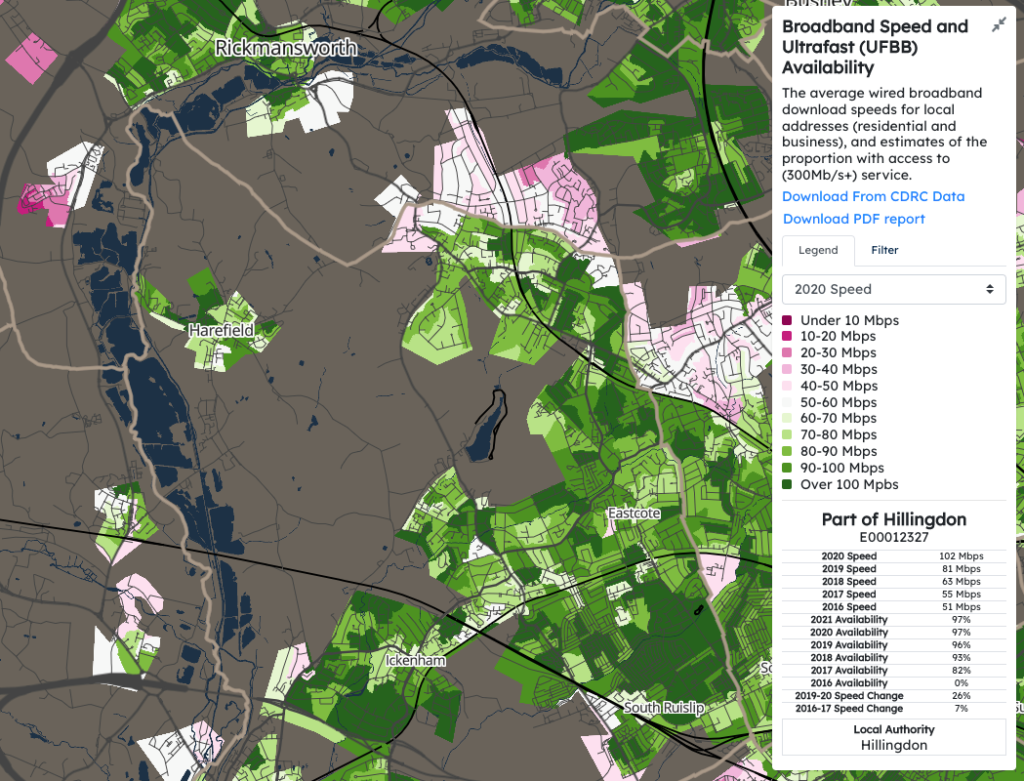
CDRC have recently replaced our venerable map website, CDRC Maps, with CDRC Mapmaker! This new flexible repository for visualising many of CDRC’s open datasets, was initially developed by Geolytix and further augmented by our own developers. The website is backed by the CARTO data platform and is cloud hosted.
Web mapping technology has come a long way since CDRC Maps was first released in 2015, with responsive, multi-platform high resolution mapping now commonplace, and CDRC wants to take advantage of these advances to create a better way of visualising our many datasets. Using a new platform also simplifies CDRC’s own processes for adding new maps, allowing our researchers to manage their map configuration using GitHub, and add and update their data using CARTO’s web-based front-end to its data platform. The “command line” is no longer needed to produce maps, and the power of the cloud ensures that our maps remain visible to the world regardless of university infrastructure changes or local issues.
Technical users might be interested to know that the website is built in ES6 JavaScript, using the Vue, Mapbox GL and Bootstrap frameworks, and built and deployed using npm and GitHub. The data is delivered to your browser in the Mapbox Vector Tiles (MVT) format.
The website is structured around presenting two types of maps – metric maps (which show various continuous variables associated with a particular dataset, sliced into groups) and classification maps which categorise areas into a single value (sometimes with a hierarchy of levels) and generally include a pen portrait description of the category.
Users can filter maps based on one or more classification categories or on multiple metric value ranges, and a PDF report can be easily produced with a view of the current map, a key and accompanying text and direct link. Clicking many of the maps will not only present the metrics or portrait, but include statistics on proportions in the current administrative area or a custom drawn region. The user interface is deliberately simple with standard pan/zoom controls, map selector, postcode search and layer toggles – that’s it.
For our initial release of Mapmaker, there are around 30 maps, covering CDRC classifications such as Consumer Vulnerability and the Internet User Classification (IUC), CDRC metric products such as Access to Healthy Assets and Hazards (AHAH) and Residential Mobility (Churn), and some popular government datasets like the Index of Multiple Deprivation (IMD), VOA building ages and Ofcom broadband speeds/availability. Some of our legacy maps remain on the old CDRC Maps platform which can still be accessed through a special menu option.
We plan to continue to refine and improve CDRC Mapmaker, including a tighter integration with our main CDRC Data platform soon, and make fuller use of the CARTO data platform as a canonical data store for our outputs.
We hope CDRC Mapmaker forms a useful visualisation tool for some of CDRC’s many data assets, and its filtering and reporting functionality allow CDRC’s data to be viewed and used in new ways.
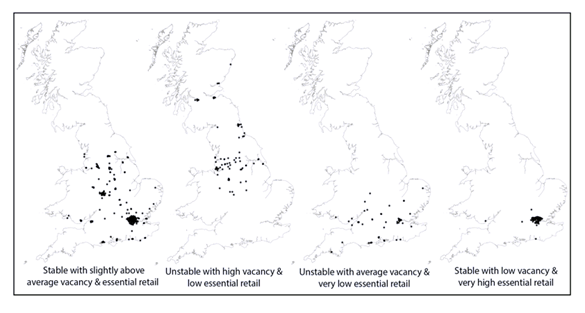
Abigail’s research uses hierarchical clustering with spatial constraints to create a typology of resilience across Britain’s high streets. The analysis incorporates a measure of the proportion of stores deemed as ‘essential’ by the British government during the numerous lockdown periods. The research found that the COVID-19 lockdown restrictions exacerbated pre-existing trends in vacancy especially for those high streets struggling before the pandemic.
Retail vacancies
Abigail said: “I am so grateful to everyone who voted for me to win the award, I hope they enjoyed my presentation and could see the policy benefits of my research”.
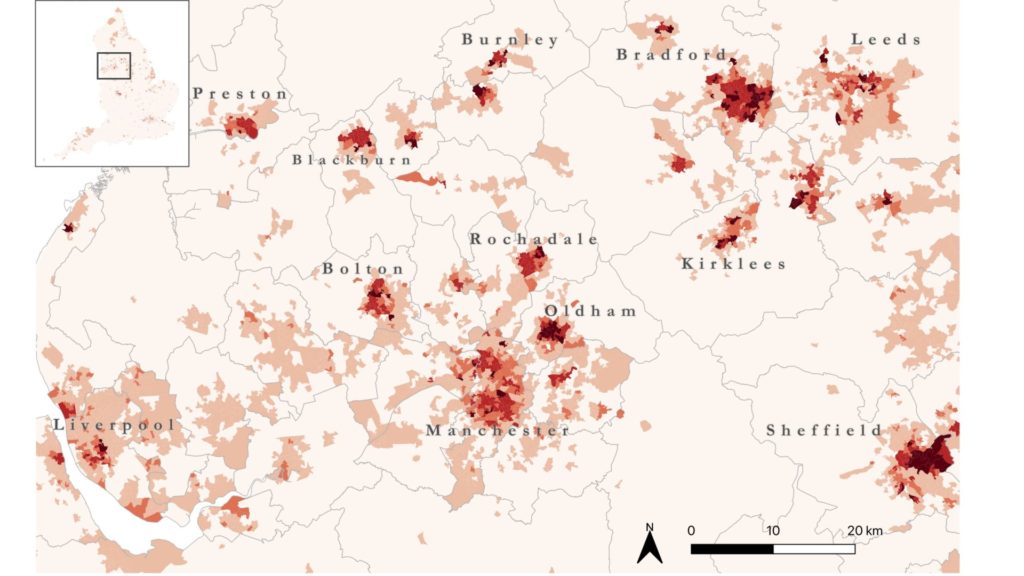
Shunya’s research explores gambling risk and vulnerability. Gambling harm disrupts the health and wellbeing of individuals, as well as families, communities and societies around them. Despite the growing recognition that gambling harms are socially and geographically uneven in their occurrence and impacts, there is limited empirical knowledge about the factors underlying the disparities. Here, we quantitatively profiled nationwide gambling surveys using a series of small area geodemographic data. Results were synthesized to devise a composite indicator of gambling risk and vulnerability that can be mapped to provide new insights into public health strategies to tackling gambling harms in a more effective manner.
Risk around Manchester
Shunya said: “I was shocked when they called my name as the prize winner but am very much honoured and proud to have our work recognised. I am grateful to the CDRC team for all their continuous support, and winning the prize has definitely given me a motivational boost in developing my research further.”
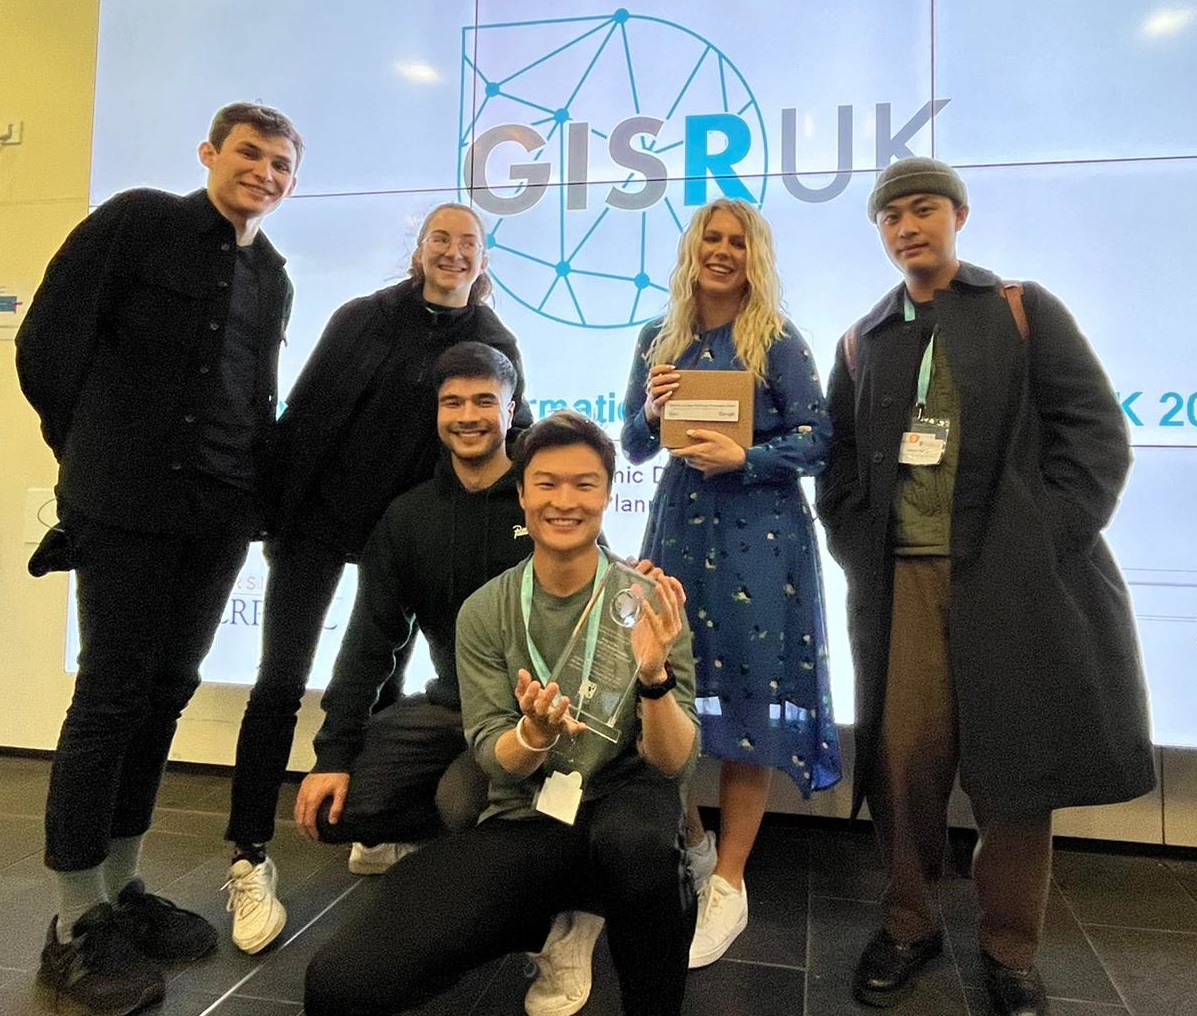
It was a great opportunity to present our research and forge collaborations for future work, as well as being the first in-person GISRUK conference for 2 years.
UCL Geography Early Career Researchers at GISRUK 2022, L to R: Jakub Wyszomierski, Louise Sieg, James Todd, Shunya Kimura (CASA Prize winner), Abigail Hill (ECR Prize winner), Jason Tang.
New datasets from growing partnership with MIAC Analytics
The CDRC are pleased to announce the acquisition of new datasets and a developing data partnership with MIAC Analytics.
The House Price Index and the Rental Index contain more than 25 years of monthly county-level data from January 1995 to the present. The data is available in a research-ready state, having been compiled and cleaned by MIAC Analytics. It will be of particular interest to researchers, including Masters students, who are examining questions relating, for example, to movements in the housing market, gentrification of neighbourhoods and geospatial economic indicators.
The datasets can be found in the CDRC Data Store. Both are Safeguarded data – access is restricted because of license conditions, but data are not considered ‘personally-identifiable’ or otherwise sensitive. Access is available via a remote service with registration and project approval requirements.
Professor Mark Birkin, CDRC Director, said: “CDRC is delighted to announce these latest data acquisitions arising from our long-standing collaboration with MIAC. The data represent a timely and welcome addition to the CDRC’s data store, increasing the diversity of our data assets across our core research themes of urban analytics, sustainable and ethical consumption, and healthy lifestyles. We look forward to continued growth in this partnership, supporting new forms of social research and the development of skills and capacity for both business and the academic sector.”
MIAC Analytics is an independent asset valuation service provider, specialising in property analytics, behavioural modelling, model validation and stress testing. Established in 1989, their head office is in New York with the UK & Europe office based in Twickenham, working from there in over 16 countries. They also have an office in Bangalore, India.
David Pickles, Managing Director at MIAC, said: “MIAC place great value on the relationship we already have with CDRC, having previously provided our Property Analytics for use within their Academic Research function. As we look to the future, we plan to explore more ways to work together to address data and modelling challenges such as quantifying climate change risks to the financial system. We are also keen to further our engagement with CDRC in terms of internships – a fruitful way to enhance student experience and career opportunity for students interested in coming into this market.”
Analysing COVID-19 Mobility Responses through Passively Collected App Data(Case Study)
Using smartphone GPS mobility data to understand population-scale responses to COVID-19 ‘lockdown’ policies in England.
Project overview
COVID-19 has prompted the enhanced use of novel mobility data in public life, offering fascinating insights into population-wide behavioural responses to Non-Pharmaceutical Interventions (NPIs) such as ‘lockdown’ stay-at-home orders. Here, we use privacy-preserving smartphone data to understand these trends at a regional scale over a longitudinal period spanning January 2020 to May 2021 for England, with a specific focus on examining adherence to policy measures on household visitation.
The concepts of adherence and fatigue to ‘lockdowns’ are highly debated ideas with limited observational evidence, despite their key role in supporting current policy assumptions. The SAGE report of 16th March 2020 underscored this when it said there was “(limited) evidence on whether the public will comply with the interventions in sufficient numbers and over time” (p.2) with respect to COVID-19 measures. Our study uses a novel measure of ‘house visits’ activity to cut out general noise and is explicitly purposed with better informing health policy interventions in the context of a public health emergency.
Data and methods
According to UK Government polling for the Centre for Data Ethics and Innovation (CDEI), 58% of over 2000 UK adults surveyed in Sept 2020 were either ‘quite comfortable’ or ‘very comfortable’ with “researchers using data to improve knowledge to help keep the public safe” during COVID-19, with just 14% being ‘quite’ or ‘very uncomfortable’. This finding was positive overall across all UK regions, all age groups, all income levels, all education levels, and whether or not people were worried about COVID-19 itself. There were also 16.5 million voluntary downloads of the NHS COVID App for modern smartphones in England and Wales in 2021. Clearly, there is a public demand for the harnessing of data to help tackle COVID-19.
Our study used anonymous, privacy-enhanced GPS smartphone mobility data from users who opted-in to data collection for research purposes under a GDPR compliant framework. Data was supplied by American and Italian location intelligence company Cuebiq, under their Data for Good program. We use unsupervised machine learning methods (DBSCAN) to make home and work area assignments, which are then taken out of user activities. Through a validated ‘process of elimination’ using POI analysis, we can then generate an aggregate measure of the proportion of de-identified users taking a house visit, for a given county area, on a given day. The output data is thus aggregated to strict privacy requirements set by Cuebiq for both temporal and spatial scales before it is analysed, yet still able to harness the precision inherent in such emerging data streams, in order to optimally inform public health policy under COVID-19. Limitations of the methods and data, including a potential lack of representativeness, were extensively discussed in the published findings. Importantly, the data could not accurately distinguish between visits to inside homes compared to outside garden areas.
Key findings
This LIDA project led to the publication of an original research paper ‘Household visitation during the COVID-19 pandemic’ in the Nature journal Scientific Reports in November 2021, detailing both methods and results.
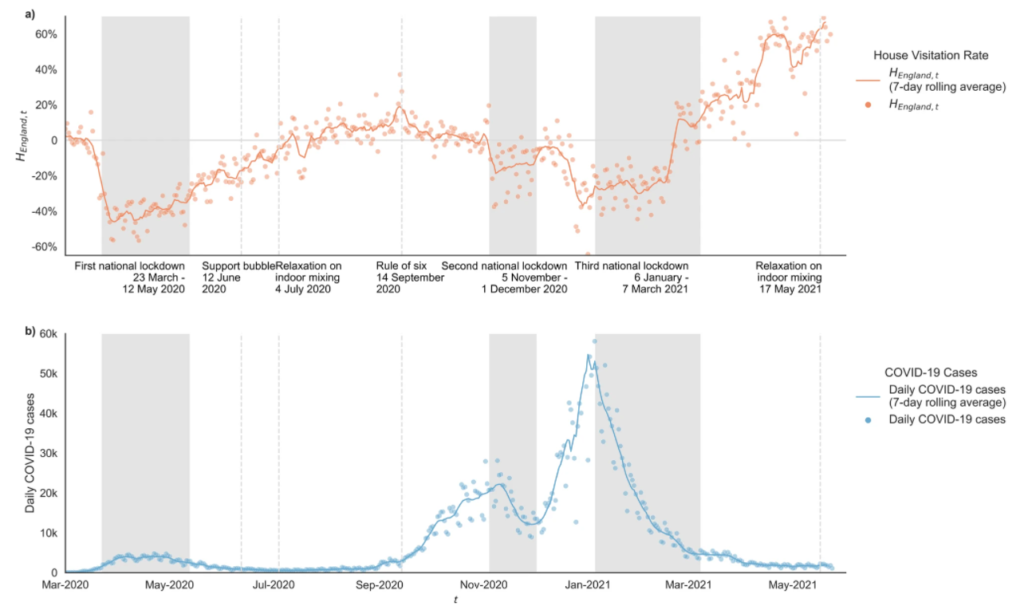
Our results track the evolution of a measure of household visitation levels in English LTLAs (Lower-Tier Local Authorities) over time – notated as ‘HEngland,t’ throughout the study. This index value was a national level, calculated through the mean average of weekly levels for each of England’s 315 LTLA areas, excluding the Isles of Scilly due to sample size issues. This weekly measure of levels of household visitation was measured against a pre-pandemic baseline figure taken from across 13th January 2020 to 2nd March 2020. The baseline was specific to both each LTLA area, as well as to each day of the week, to account for relative changes in each locality.
Figure 1: Time-series showing levels of household visitation across Jan 2020-May 2021 (mean average Lower-Tier Local Authorities rate in England against area- and day-specific 2020 baseline), alongside new COVID-19 cases. Source: https://www.nature.com/articles/s41598-021-02092-7/figures/1
Figure 1 from the paper here shows the evolution in ‘HEngland,t’ across the full study period, as well as the evolution of recorded COVID-19 cases. As can be seen, levels of household visitation dropped dramatically in late March 2020, dropping to an all-pandemic period low of –56.4% relative to pre-pandemic baseline levels on 29th March 2020. In Figure 1 we have marked ‘national lockdown’ periods as those when stay-at-home orders were in place, during which time household visitation was prohibited in almost all cases. By taking mean averages across these time periods, we can witness household visitation levels averaging −39.33% during the 1st National Lockdown (23/03/20 – 12/05/20) below baseline levels, compared to higher rates of average house visits activity recorded during the 2nd National Lockdown (05/11/20 – 01/12/20), when rates were only averaging −15.28% below pre-pandemic levels by comparison. We didn’t witness a great jump in household visitation in the immediate aftermath of the introduction of ‘support bubble’ exemptions in mid-June 2020.
Heading into the 3rd National Lockdown (06/01/21 – 07/03/21), mobility activity reduces pointedly ahead of the imposition of national restrictions, reflecting perhaps the impact of COVID-19 risk perception and/or the new Tiered restrictions announced on 19th December 2020 in response to the detection of the new Alpha variant in South-East England. These trends were reinforced by the imposition of the 3rd National Lockdown on 6th January 2021, which kept levels of household visitation at levels between the 1st and 2nd National Lockdowns at -26.22% below (06/01/21-14/02/21) baseline rates until approximately mid-February 2021.
At this point it was announced by the Prime Minister during a 10 Downing Street Coronavirus television briefing to the nation that 15 million people from the most vulnerable categories in JCVI Priority Groups 1-4 had received a first dose of COVID-19 vaccination. Almost immediately a significant rise in household visitation rates were witnessed by our metric ‘HEngland,t’ across England, such that by the 7th March 2021 levels of household visitation were comfortably above the pre-pandemic baseline, even though coronavirus regulations had stayed the same.
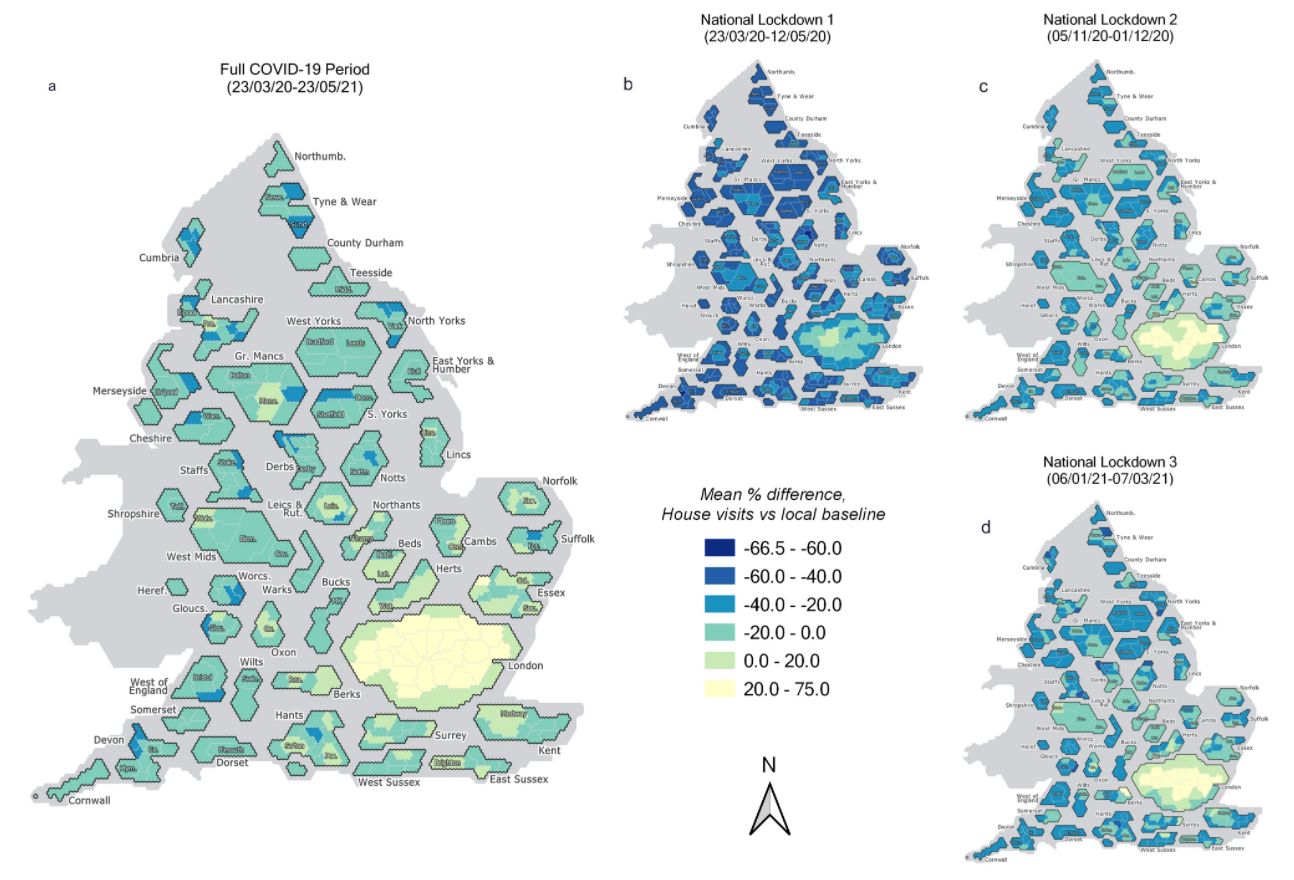
Figure 2: Hex cartogram maps illustrating comparative levels of regional disparities in visitation rate across the whole COVID-19 period studied and for each of the three ‘National Lockdown’ periods. Source: https://www.nature.com/articles/s41598-021-02092-7/figures/2
Figure 2 here illustrates the geographical variation in these household visitation rates for Local Authority Districts at LTLA scale, as mean averages across a) the entire COVID-19 period, and then, for b)-d), across the three National Lockdown periods respectively. These are presented as hex cartograms, prepared with assistance from the UK House of Commons Library. Some regional disparities are shown, notably between North and South, and between urban and rural areas. London boroughs, in particular, appear to have consistently higher relative rates of visitation against the pre-pandemic baseline than elsewhere in England.
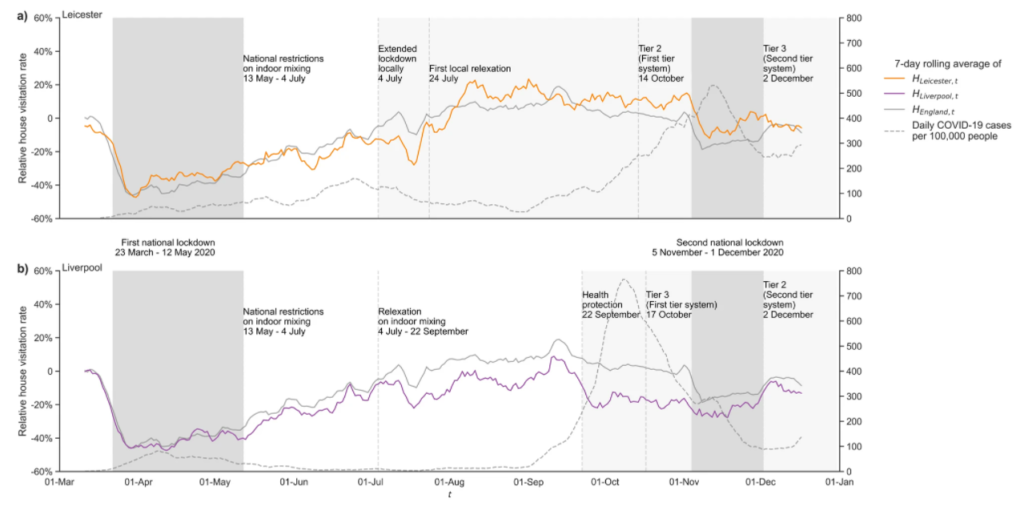
Figure 3: Time-series showing levels of household visitation in two LTLA local authorities – Leicester and Liverpool – which experienced ‘local lockdown’ policies impacting household visitation, against the national level for England in grey. Source: https://www.nature.com/articles/s41598-021-02092-7/figures/4
Figure 3 here finalises this summary of our key results, by showing the findings when applied to two individual local authority areas that experienced specific and rigorous local restrictions to tackle sudden outbreaks in cases over summer 2020 – ‘local lockdowns’ as they became known in England. Here, the cities of both Leicester and Liverpool are shown to have exhibited a likelihood of different profiles of adherence to ‘local lockdown’ measures on household visitation. In the case of Leicester, despite a great reduction in visitation when local lockdown was at its strictest compared to the national trajectory, a serious rise in household visits (to above the national level for England) occurs just around the time of the first relaxation on 1st August 2020, even though this didn’t revoke the restrictions prohibiting house visits. By contrast, in Liverpool house visits had stayed meaningfully below the national figure for England throughout the summer period, including after regional measures were introduced on 22nd September 2020.
Value of the research
The research had been directly designed to inform public policy, aligned with LIDA’s commitment to using data for public good. Understanding actual levels of likely aggregate adherence to pandemic policy was highlighted as an area of importance by the House of Commons Health and Technology Select Committees joint report into the UK coronavirus response – “Coronavirus: lessons learned to date” – published in September 2021.
Many activities driving virus transmission are intimately connected to the mixing and mobility of individuals. Our observational findings on behavioural responses in house visits will therefore allow public sector agencies to better understand how English populations responded to a range of lockdown impositions and relaxations, as well as allow us to see how these responses may have been complicated and/or influenced by concurrent public messaging and prevalent COVID-19 risks. A mix of past national and local lockdown policies can therefore be optimised and/or evaluated using our results. The Scientific Reports research paper disseminating the results was highlighted in the ‘Behavioural Science and Insights Unit Weekly Literature Report’ of the UK Health Security Agency (UKHSA) in late November 2021.
The findings received significant coverage in the national British press, featuring in Metro, The Daily Telegraph, The Independent, Daily Express, Daily Mail, The I paper, as well as in other national-scale publications including the Yorkshire Evening Post, The Conversation and current affairs magazine The Week. This was supplemented internationally by mass online coverage from Yahoo! and MSN. According to Altmetric, as of 20th January 2021, the research paper has also been shared on Twitter to a combined total of 2.69 million followers.
Quote from project partner Cuebiq
“We’re proud of the exceptional and novel research led by University of Leeds, not only because it created impactful public goods, but also because it was achieved with an uncompromising commitment to data privacy and governance.”
Insights
Measures indicate adherence to household visitation restrictions was relatively high overall but waned both within and between subsequent National Lockdowns in England. This is rare observational evidence for shorter- and longer-term ‘fatigue’ in compliance with COVID-19 restrictions, at various stages of the pandemic lifecycle.
About 15th February 2021, when the Prime Minister informed the nation that 15 million people from the most vulnerable in JCVI Priority Groups 1-4 had been vaccinated, a significant and unprecedented rise in household visitation rates was witnessed nationally, to above pre-pandemic base rates, despite lockdown regulations staying the same. This indicates that people may have paid meaningful attention to levels of protection carried by the most vulnerable members of British communities when determining their visiting activities, and/or have adhered far less to relevant pandemic regulations once vaccinated.
Measures of household visitation indicate that household visitation activity was responsive to prevalent COVID-19 risk, ahead of the implementation of restrictions (i.e. Alpha variant in December 2020), as well as before they were officially lifted (1st and 3rd National Lockdowns), offering evidence individuals may respond to a perceived personal and/or collective risk of COVID-19 infection over and above current government policy or guidance.
Local lockdowns in Leicester and Liverpool indicated a likelihood of contrasting profiles of adherence over time to ‘local lockdown’ measures prohibiting household visitation, also highlighting the potential of smartphone mobility data to indicate waning population-wide adherence in a single aggregated local authority area (where sample size N > 10 is consistently satisfied, to protect against the risks from Statistical Disclosure).
Cuebiq mobility data for England is geographically representative across a series of temporal and spatial aggregations, and across several points in the pandemic for our sample, even if other factors of social representativeness remain rightly unknown.
Research theme
Health informatics & urban analytics.
People
Mr Stuart Ross, LIDA Data Scientist Intern
Mr George Breckenridge, LIDA Data Scientist Intern
Dr Mengdie Zhuang, Lecturer in Data Science, University of Sheffield
Prof Ed Manley, Professor of Urban Analytics & LIDA Fellow
Partners
Data provider: Cuebiq Inc., NYC, Milan
Funders: LIDA intern work funded by the CDRC (Consumer Data Research Centre), so in turn by the ESRC (Grant ES/L011891) of UKRI. Broader research project also supported by i-sense, so in turn by EPSRC (Grant EP/R00529X/1) of UKRI
What attracted you to working on a project in partnership with the Consumer Data Research Centre (CDRC?)?
Prior to studying the MSc Business Analytics program at UCL, I studied Psychology at King’s College London, so I’ve always been interested in the topic of consumer behaviour. Therefore, applying to a project in partnership with the CDRC was a natural next step.
I came across the CDRC – a centre which leads engagement between industry and academia – through the MSc Business Analytics Program Director, David Alderton. I was particularly drawn to the project topic by Entain. I was unfamiliar with the company at first, until I realised they owned the big-betting brands Ladbrokes and Coral. Having been in London for four years, I’ve definitely come across their betting shops while walking around the city.
Ultimately, the opportunity to analyse consumer behaviour and knowing that Entain is a leading company within the gaming and sports-betting industry was what motivated me to apply to their project in partnership with the CDRC.
What problem or need was investigated through the student consulting project?
The pandemic-driven changes in consumer behaviour led to the hypothesis that, during lockdown, a lot of Entain’s new online customers have a retail background – meaning that they are retail customers who may have migrated online due to retail shop closures in the UK.
With methods of classification, we can predict whether an online customer has a retail background; and we found demographical and behavioural differences between groups of online customers with and without a retail background. While the findings of the project can be turned into strategic customer segmentation to generate higher revenue, it can also be used to analyse the differences in manifestations of problem gambling between the customer groups to create a more sustainable customer base. More on the project is available in my abstract.
How do you think the skills that you learned on the MSc Business Analytics program helped you support Entain?
The project was dependent on the use of programming tools which I had no prior knowledge in before the course. Particularly, the modules Statistical Foundations of Business Analytics, Marketing Analytics, Programming and Predictive Analytics helped me support Entain throughout the project as it taught me to utilise R and Python to analyse data, and to train machine learning models. Not only that, but the way the course organisers dealt with the pandemic and structured the online learning taught me soft skills which helped me adjust to the ways of online working. This was particularly useful while conducting the project during the pandemic, and with the fact that the Entain team was based in Gibraltar while I was based in London.
Can you tell us a little about winning the best dissertation award?
After completing the project, I was notified by the CDRC that I was shortlisted for the 2021 cohort’s top three dissertations. I was invited to present my project alongside other shortlisted candidates, which was followed by a virtual prizegiving ceremony. Winning the best dissertation award was very rewarding, and I would like to share two lessons that I have learned:
1. Projects come in different shapes and forms
Having the opportunity to watch other candidates’ presentations of their projects gave me insights into what other students worked on for months, which were completely different to my project. This showed me that dissertation projects encompass a broad range of topics, which made me appreciate the scale at which analytics could be applied into.
2. The importance of communication skills
I learned that having communication skills is critical in dissertation projects. I thought, how do I present my results such that they are meaningful to the audience? Whether it be academics or business’ stakeholders, no matter how good the analyses are or how complex the methodology is, the project must be communicated well for others to appreciate it as much as you do.
When did you graduate and what have you been doing since you graduated?
I graduated from MSc Business Analytics in December 2021. Since then, I have been working as a Data Analyst at Entain in their Compliance/Safer Gambling Analytics Department. Within the role, I am responsible for managing end-to-end analytics projects relating to the management of customer journeys to promote safer gambling. The projects start with data extraction and analysis through SQL, R and Python, and end in translating the findings into actionable insights presented through PowerPoint or visualized through Tableau dashboards.
I would like to give special thanks to the Entain Gaming team – Piotr Smolinski, Joana Georgieva, and William Collins – for guidance and mentorship throughout the project; to the CDRC for the opportunity to work on the Masters’ Dissertation Scheme; and to David Alderton for the support from UCL as a Program Director and Personal Tutor.
Fruit and Veg Findings – IGD behavioural insights report follow-up
November 2020 brought a series of sustainability goals to the forefront with COP26, and linked initiatives such as the Earthshot Prize, rightly monopolising media attention. Tackling climate change was not only of great importance to policy makers in Glasgow, but also to companies and consumers around the world.
Our global food system is the second biggest contributor to climate change [1]. Retailers and manufacturers in the UK food industry are responding to this and are working hard to be a driving force of change. IGD’s Healthy and Sustainable Diets Project Group and WWF’s recent Retailers’ Commitment for Nature are examples of the brilliant collaboration happening in the sector to reduce the toll that our weekly food shops have on the environment.
This November also saw the release of the Institute of Grocery Distribution’s (IGD) Behavioural Insights Report. The report shares the first findings from our ongoing research, in partnership with IGD and their Healthy and Sustainable Diets Project Group, where we look at how healthy choices and sustainable choices can be one and the same.
Can food retailers and manufacturers make the shift towards a healthy and sustainable diet easy, accessible and appealing to consumers at the point they are purchasing and planning their food for the week?
To investigate this, interventions have been co-designed by IGD, members of IGD’s Healthy and Sustainable Diets Project Group and the University of Leeds, to trial one or several of the behavioural levers below.
A 4-week national price reduction trial to encourage greater fruit and veg, tested year on year
The first exciting trial we have been studying is Sainsbury’s ‘60p Fruit and Veg’ campaign.
Looking to increase the amount and variety of fruit and vegetable products in shoppers’ baskets, Sainsbury’s ran a promotional intervention for four weeks in both January 2020 and January 2021. These promotions reduced the price of selected fruit and vegetables to 60p in store and online.
Signposting and placement were used alongside incentivisation to draw attention to the offer. Our research aimed to determine whether this multi-levered approach led people to make healthier and more sustainable choices, and monitor whether any change was sustained in the nine months following the trial.
The trial was varied each year in the selection of fruit and vegetables chosen for the offer: thirteen products were on offer in 2020 and seven in 2021. Furthermore, the first trial in 2020 was outside of national lockdowns, whereas the second trial, in 2021, occurred during one.
Studying 23.4 million baskets
For our initial findings, we analysed national unit sales data for 23.4 million baskets that contained a promoted fruit or vegetable item between January 2019 and March 2021. Following the sales over this period allowed us to observe purchasing trends and establish a comparative January 2019 baseline for each product.
Our findings
Our analysis is presented in terms of portions, reminding us of the impact our consumer choices have in terms of our plate. To calculate this, each unit sold was translated into portions as defined by product weight, where one portion of fruit or vegetables is equivalent to 80g [2].
An impactful intervention year on year
Our first finding was pleasing, yet slightly expected: when on offer, sales increased for the promoted items.
Promoting fruit and veg increased sales by over two million portions, compared to the control year
Each year we saw an uplift in sales during the promotional period, well above the January 2019 baseline for the selected products. In total, 2.8 million more portions of promoted fruit and vegetables were sold in 2020 during the four weeks of the promotion than the previous year, across 101 stores which ran the intervention in both years. Similarly, 2.1 million more portions were sold during the 2021 promotion than in the same period in 2019, for the 101 stores.
Less impact during the national lockdown
Consumers engaged with the promotion each year, purchasing promoted products well above their 2019 levels. While both years of the promotion were successful, the second year saw slightly less impact than the first. Sales of the promoted items increased from baseline by 78% (2.8 million portions) in 2020 and by 56% (2.1 million portions) in 2021.
The 2021 trial took place during a national lockdown, when food shopping became a more pragmatic procedure. Placement and signposting were therefore probably not as strong at directing shoppers’ attention and influencing their basket.
Prior to starting our analysis, we anticipated the data may reflect effects of the pandemic alongside the effects of the trial. It is important to keep this context in mind when interpreting the data. The lower portions sold in the second year may be partly attributed to the different food landscape, however, we also have to bear in mind the differing items on promotion.
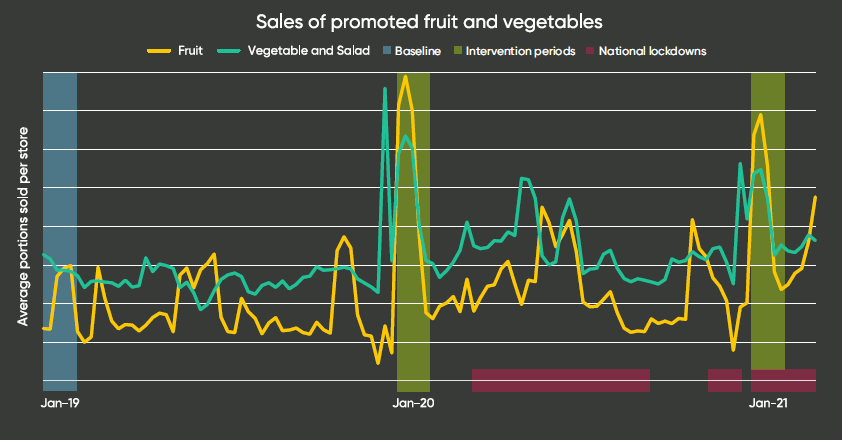
Below you can see a timeline of average portions sold per store from 2019-2021, across the 101 stores (noting it only considers items offered in the promotion). The figure illustrates seasonal shifts in consumer behaviour, essential to developing a holistic understanding of the trial’s impact.
Weekly plot of mean portions sold per store for Fruit or Vegetable items offered in the promotion. Unit Sales data was provided by Sainsbury’s. Calculated across the restricted subset of 101 stores which ran the 60p Fruit and Vegetable promotion in both years.
Looking at the highlighted intervention periods, we observed a sales spike in both January 2020 and January 2021 during the promotion, emphasising those 2+million additional portions sold in each year.
Impactful, but not sustained
The timeline above plots weekly sales data. Curiously, the high level of engagement drops off in the final week of each trial. This decline may reflect people’s finances prior to payday, or may suggest that using Placement and Signposting only interrupts behaviour for a short time before going unnoticed by shoppers [3].
Some products were more appealing than others
Higher-value items were most popular, such as kale, kiwi fruit, pineapple and mango. Noticeably, these items also require minimal preparation and mostly encompassed exotic fruits. In contrast, swedes, radishes and red grapefruits were less popular in the promotion.
January – a popular month for fruits and vegetables
Important questions to understand, with the goal of encouraging people to embrace healthier and more sustainable diets, are: were customers adding items to their basket to up their fruit and vegetable content overall? Was this a shift within their usual purchasing habits?
For the last two years, around four million more units of fruit and vegetables were sold in January than the following February. Promoted items made up 9% of produce purchases during the four-week intervention period in January 2020 (dropping down to 5% in the four weeks that followed), and 8% during the four-week intervention period in January 2021 (dropping down to 6% in the four weeks that followed).
These figures indicate that the promoted items contributed to the high fruit and vegetable sales in January, but did not fully account for the uplift. There are many reasons why people may have picked up more fruit and vegetables in January, such as the growing Veganuary movement or a healthy eating New Year’s resolution. So, how do we determine the promotion’s success apart from a January health kick? Studying one year pre-intervention allowed us to establish baseline sales for the selected products. The 2+million portions sold above baseline indicates that the sales spike in January 2020 and 2021 can be largely attributed to the promotion.
Next stages
So, are promotional interventions successful? Sainsbury’s 60p Fruit and Vegetable promotion was extremely successful initially, causing a short-term sales uplift for items on offer. However, we saw this was not sustained as sales declined in the fourth week.
Our next step is then to look across people’s baskets and see what other items they were purchasing. Was their basket closer to the Eatwell Guide (the model diet we use as a metric to measure success) when engaging with the promotion?
There are many exciting developments in the wider work ahead for this partnership. More trials are underway, watch this space!
About the Author: Alexandra Dalton currently works as a Data Scientist at the Consumer Data Research Centre following her data science internship at the Leeds Institute for Data Analytics (LIDA). Alex and a team of researchers from the University of Leeds have worked in collaboration with IGD, major retailers and UK manufacturers to evaluate strategies to promote healthier and more sustainable dietary choices. She is interested by consumer data insights in the intersectional field of sustainability, nutrition and lifestyle analytics.
Networking and Partnership Building: An intern’s perspective
Introduction
I want my work to have an impact and I believe that harnessing the increasingly available abundance of data is one way of ensuring this. LIDA presents the opportunity to combine my sociological and quantitative/computational skills, and I feel grateful that my internship project with the CDRC at LIDA synchronizes my expectations perfectly.
I work on the OpenInfra project, exploring the potential of (crowd-sourced) open-access data (OpenStreetMap) in planning active travel infrastructure. Open data could lead to a more accessible and inclusive decision-making process by including citizens in the process of building the active travel infrastructure and network they want to use every day. However, the data is “messy”, constantly updated but still lacking completeness. It is open but not easy to access or use, and although it might have mapping protocols in place, this does not mean that there are no errors (my all-time favourite is the width value of –1).
To help reduce the scope of the problem, I decided to focus on accessible pedestrian infrastructure. One of the first things I did was search for relevant policy documents. The Inclusive Mobility guidewas released over 10 years ago (it has now been recently updated), so I suspected that it might not contain the most up-to-date recommendations. I thought that familiarity with current qualitative research on accessible pedestrian infrastructure might identify what essential information on street elements might not be, as of now, representable in OpenStreetMap.
As I was searching for qualitative research on my subject, I discovered an on-going project at the University of Leeds that has various synergies with my project, so I contacted them. This was the first time I had ever reached out to someone to explore how two projects might collaborate together, so it meant stepping out of my comfort zone. Whilst not easy, it is proving to be very rewarding. Here, I will share some lessons learnt that, I believe, gave ground to successful networking and partnership building.
Seeking Partnership
Before I discuss building partnerships with external stakeholders, I want to highlight that the most important partnership to build is with your project team. Mutual trust and support between you and your supervisors are integral to advancing any project.
Writing that first email
In my case, I sought partnership to get a better grasp of my project and data needed for accessible pedestrian infrastructure planning. A clear idea of “why” gives purpose for reaching out. For me, it was helpful to think about the initial email as a cover letter. The following questions guided my email:
Introduce yourself: who are you? Why are you qualified to contact them?
The why: why are you contacting them (e.g. expertise in a domain, methods)? How did you find out about them?
Benefits: what are the potential benefits of them partnering with you?
Call to action: what do I want to achieve as a result of this email (e.g. organize a meeting)?
In my case, the trickiest part was to identify why they would be interested in meeting me. I approached this by reading their project website and an academic paper their team had published, trying to understand the project and agenda/factors that drove them as a team. I found that raising awareness of the struggles faced by people with disabilities is integral to their project. We also want to highlight the importance of mapping data relevant for accessible pedestrian infrastructure, so in my email I noted this overlap. I was careful not to overpromise or come across as too certain of their interest at this stage.
Initiating a partnership for the first time can be challenging. It took more than two weeks for me to sit down and write that email, not because of a busy schedule, but because I was worried about not receiving a reply. The key factor in overcoming this was acknowledging it and recognizing that it goes hand-in-hand with my imposter syndrome. Being honest with myself helped to put everything into perspective: nothing but time would be lost if I sent an email, but I would gain self-confidence and, potentially, a meeting. I was also aware of my project team being positive about me contacting them, therefore trusting me enough to enable me to give a personal touch to the project. These little realizations, or rather self-reminders, were very reassuring and empowering, leading to my first successful initiation of partnership building.
Scheduling and running the meeting
When I got a positive reply from them, I was over the moon – proud of myself for having taken that first step! Yet, I also knew that the next step was the meeting scheduling. Retrospectively, I can say that scheduling requires active listening. For example, there was a person in their team who currently lives in another time zone, hence I was asked to schedule meetings after 4PM GMT. Little pieces of information like this might pave the way for a successful meeting before it even starts!
Leading a meeting was an unknown field for me. I had a myriad of questions ranging from chairing the first meeting to making sure that the meeting allowed for discussion of both projects in parity, as well as the potential bridges between them. Here, I took advantage of the fantastic LIDA community and asked my personal buddy to share her experience. I got an invaluable piece of advice – do not be afraid to communicate your aspirations and hopes for the meeting up-front. Indeed, from the first email enquiry, this collaboration was about communication and testing the ground, so the meeting did not have to be “perfect” to be productive. This realization took the pressure off my shoulders.
The meeting went really well: it reassured me that our project is timely and needed and, more importantly, it exposed me to new interdisciplinary ideas and applications of OpenStreetMap data. For example, we discussed the potential of addressing the qualitative-quantitative divide (often thought of as binaries), organizing walk-alongs and mapathons, and a question on using OpenStreetMap data for 3D modelling. Not all of these ideas may be realised, but the process of engagement and listening have broadened my perspective on OpenStreetMap and its applicability to qualitative research. Finally, it made me feel that I am working towards doing what I set out to do: combining my sociological and computational skills for social good.
Final thoughts
The entire experience of reaching out has not been just about networking and partnership building per se, but also stepping out of my comfort zone to suggest (and realise) ideas to my project team. It can be challenging to do if you (as I was) are assigned a project that is far from your field of expertise. Here, again, I want to reiterate the importance of building collaborative working with your project team – it takes time, trust, and willingness to communicate honestly, especially about fears and worries. Indeed, imposter syndrome can hinder my motivation more often than I would like, but moving one step at a time and, most importantly, collecting and appreciating those steps have been invaluable, especially in the face of stakeholder meetings.
The experience of networking and partnership building has strengthened the central position of communication in a (data science) project. Not only does it help to promote or disseminate its outputs, but also to shape one’s own perspective towards the project itself. For me, listening emerged as a key tool of effective communication, that perhaps needs to be given more credit in data science if the project is to have a real-life impact.
Author: LIDA Data Scientist Intern, Greta Timaite. Greta has a BA in Sociology and an MSc in Big Data and Digital Futures from Warwick University.
The need to rapidly rollout COVID-19 vaccinations in England brought issues of geographical accessibility to the fore. Ambitious targets to double-vaccinate every eligible member of the adult population, within a matter of months, presented considerable challenges. The Department of Health and Social Care’s ‘UK COVID-19 Vaccines Delivery Plan’ set ambitious targets for all households to be within 10 miles of their nearest vaccination site. Figures published periodically by the NHS (available here) suggested that almost 100% of households met this target, yet media reports frequently suggested that thousands of households faced challenges in accessing vaccination sites due to impracticably long journeys or lack of available public transport, especially in many rural areas.
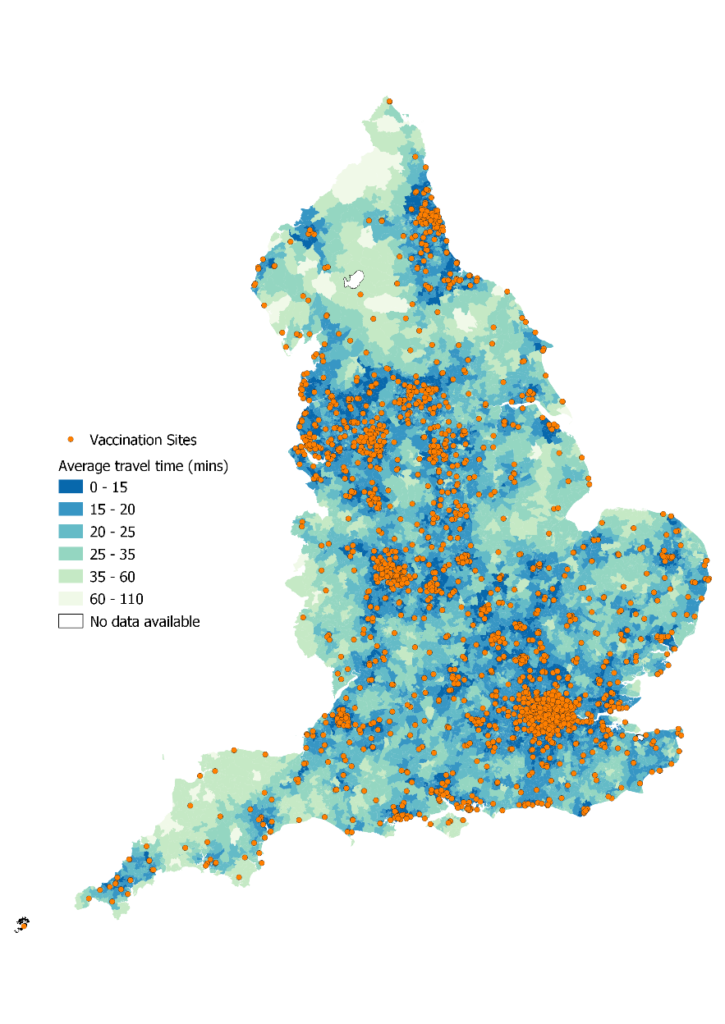
Recently published CDRC research, carried out in conjunction with commercial partner HERE Technologies uncovered inequity in vaccination site accessibility, highlighting inequalities that are hidden by NHS-reported assessments of vaccination site coverage. Our analysis reveals that over 90,000 households – all of which are inferred to lack access to public transport – face modelled journey times in excess of 1 hour to reach a vaccination site, with regional and urban-rural inequity evident (Figure 1).
Figure 1: Average journey times to closest 5 vaccination sites by all modes of transport.
Whilst mass-vaccination centres – some capable of vaccinating thousands of individuals in a day – offered operational efficiencies and economies of scale, these were largely confined to urban areas. Our research highlights the importance of local provision of COVID-19 vaccinations via consortia of GP-practices, and makes recommendations to support the continued delivery of booster jabs and other mass-vaccination programmes.
These analysis were only possible given the availability of open data from NHS England, coupled with comprehensive routing data from HERE Technologies. These data permitted calculation of validated travel times between residential neighbourhoods and vaccination sites, accounting for mode of transport and time of the day. The CDRC is uniquely placed to leverage domain-specific expertise, in this case from colleagues in the School of Geography, University of Leeds, in conjunction with high-quality commercial data such as those supplied by HERE.
The analysis reported here was undertaken by MSc student, Catherine Duffy, as part of the CDRC Masters Dissertation Scheme, which links Masters students with commercial sector partners. Catherine, a Geography Graduate from Leeds, was undertaking the MSc in Data Science and Analytics, and now works in a related role in the commercial sector.