Physical activity behaviour over time – who, how much and when

Trainer clad feet moving right to left along a thin path in the middle of green grass

Physical activity behaviour over time – who, how much and when

A New Year can mean New Year’s resolutions. Commonly these revolve around weight loss, joining the gym or being more active. Though most people start with good intentions, many resolutions don’t last throughout the year (or even this far into the year!). Equally, many other factors influence how active we are at different points in the year.

With our research, we were interested in identifying whether there are different patterns of activity behaviour in different groups. And, in addition, how these patterns over time were linked to other characteristics such as age, gender and preference of activity type.

We investigated patterns of activity over both the week and the year using daily step count data. Interested in shorter term activity patterns, we wanted to know if people were more active mid-week or on weekends. We were also keen to understand whether activity behaviour was consistent throughout the year or whether it fluctuated across the seasons. Using a cohort of physical activity tracking app users (for more info see previous blog post) we utilised over 30,000 years’ worth of activity across more than 1,000,000 user recorded weeks.

Yearlong activity pattern insights

Looking at behaviour across the year, users fall into seven distinct patterns of behaviours, known as clusters (Figure 1). At the bottom of figure 1 we have the “inactive cluster” (turquoise) who were inactive pretty consistently across the year. On the flipside, the yellow ‘highly active yearlong cluster’ were consistently active throughout the year, on average exceeding 15,000 steps a day (equivalent to around 7 miles a day).

Figure 1: yearlong activity behaviour clusters

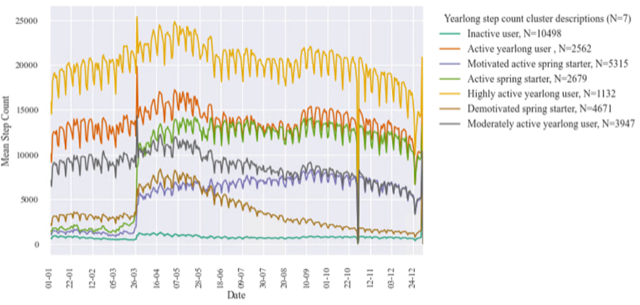
Several of the other clusters follow the same pattern as the highly active cluster, but at lower activity intensities (the orange and grey clusters). The spikes at the end of March and October indicate the start and end of UK daylight saving. The impact of daylight saving on activity is demonstrated with higher activity in the summer months (more hours of daylight and generally better weather) compared to the winter months. In contrast to the clusters showing seasonal variation in activity, we also see evidence of users showing both motivated activity behaviour – increasing activity as the year progresses (purple cluster) – and demotivated activity behaviour, where the reverse is true (brown cluster).

Weekly activity patterns insights

Similar analysis investigating weekly behaviours, shown in figure 2, demonstrates how, across the week, users show six distinct patterns of behaviour. Three groups are consistent in their activity level at either a low, somewhat or high physical activity intensity (green, pink and orange clusters). Two groups were more active during the week with lower levels on activity on the weekends, again at different levels of activity intensity, indicative of activity associated with commuting (the brown and grey clusters). The final group, the ‘weekend warriors’, were more active on the weekend than weekdays (teal cluster).

Figure 2: weekly activity behaviour clusters

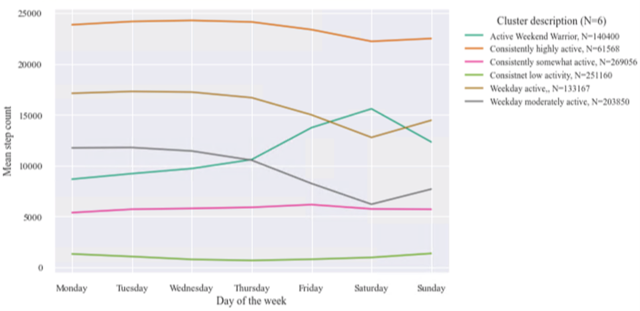
Consistent activity throughout the week was associated with recording more active minutes overall and was therefore more likely to meet physical activity guidelines than those just active on weekdays or weekends.

Demographic insights

Users in the different clusters also displayed different demographic characteristics. Older age was associated with being in the most active cluster of yearlong behaviour.  A user in the most active cluster was also more likely to be male, but the same is true as well for the inactive cluster. Female users were more likely to be in the moderately active groups, or show motivated or demotivated behaviour across the year, rather than the typical seasonal fluctuations in activity.

Moreover, users tended to record a variety of different weekly activity patterns across the year – for instance, three weeks of weekday active behaviour might be followed by a couple of highly active weeks. Different weekly activity clusters were more predominant in the overall yearlong activity behaviours. Unsurprisingly, the highly active yearlong cluster was made up of users who recorded a large proportion of weeks which were classed as highly active. Those who were active during weekdays were also more likely to be active throughout the year. This enables us to build up the picture of how shorter-term activity patterns contribute to longer term habitual activity.

By targeting policy towards the shorter- and longer-term clusters of behaviour we can increase overall activity. For example, guiding those usually only active during the week to accessible weekend activities such as Parkrun, or suggesting ways to incorporate activity mid-week for the ‘weekend warriors’. Looking at seasonal activity we can start to investigate interventions to stop activity levels dropping with the reduced hours of daylight in winter, such as better street lighting or greater provision of indoor activities.

The full paper is openly available: https://doi.org/10.3390/ijerph182111476


Fran Pontin is a CDRC Research Data Scientist and former Data Analytics and Society CDT student. Her PhD looks at the utility of secondary smartphone app data in capturing physical activity behaviour over a wide spatial scale. With a background in Food Science and Nutrition, her research interests lie in the use of consumer data to capture and better understand health behaviours and drive targeted policy change. Fran also provides Python training on behalf of the CDRC, aiming to make the analysis of large-scale consumer data accessible to a wider audience.

New ESRC funding secures CDRC future!

New ESRC funding secures CDRC future!

The Consumer Data Research Centre has been successful in applying to the Economic and Social Research Council (ESRC) to continue their data services from April 2022 to September 2024.

This officially marks the next phase for the CDRC, during which the Centre intends to build upon its proven vision and strategy, combining a unique, cloud-based data infrastructure with an established framework for supporting innovative research and capacity building.

The award will allow the CDRC to continue to increase the access, creation, use and awareness of DigitalFootprint Data (DFD) such as geo-spatial, commercial, transactional and sensor data, and advance the quality, quantity and impact of social science research.

This latest endorsement by the ESRC marks the most recent milestone in the continuing evolution of the CDRC since 2014. The award will allow the CDRC to build on our successes, supporting thriving interdisciplinary DFD communities to address the most urgent research and policy questions, which have been raised by both the challenges and opportunities of a post-COVID society.

We were thrilled that our bid was given particularly positive feedback for clearly providing “a strong asset and a foundational infrastructure” and “growing number of research outputs”, as well as “sustaining the foundations of innovative, creative and widely-used data infrastructure across the social sciences”.

The positive funding outcome means that, from April 2022, the Centre will be able to not only maintain its existing infrastructure, but also to foster innovation through partnerships that promote further collaboration across multiple disciplines, both within our local institutions and across a wider network of academic and external stakeholders.

This funding was provided via UKRI ESRC’s World Class Labs budget to support expansions and upgrades to existing social science data infrastructure.

Household mixing during COVID-19 lockdowns

Household mixing during COVID-19:
research suggests adherence to lockdowns in England declined over time

The grim prospect of COVID-19 stay-at-home orders is back in the news, with a number of European countries having either introduced new restrictions or reimposed full lockdowns amid rising cases. These developments inevitably raise questions around how we can best shape public health policy to reduce virus transmission.

One key challenge is reducing “risky” interactions between people, such as household visits indoors. We know close proximity and inadequate ventilation increase the chances of the virus spreading, leading to rising rates of illness. Yet our understanding of these household visitation behaviours, and the effectiveness of policy to reduce them, is lacking.

So in our latest research, we analysed mobility data collected from almost one million people in England between January 2020 and May 2021, seeking to understand trends in home visits during the pandemic.

This data was collected via location-based mobile phone apps by the data company Cuebiq, who obtained consent from users for their anonymised data to be used for research purposes. Working with Cuebiq we were able to generate aggregate analyses without obtaining any individual or household data (that is, none of the data we used could be linked to specific people).

Our interest here was in regional and national trends in mobility, and how populations moved around during the pandemic. For each region we developed indicators of visitation rates to residential areas outside of usual home areas, and assessed how these rates varied from baseline levels set in January and February 2020.

What we found

We saw a rapid reduction in people visiting other residential areas during the first lockdown in March 2020. The average decrease over the duration of the first lockdown was 39.3%, while at the lowest point, this activity was 56.4% below baseline levels. Rates of interaction increased prior to the end of the lockdown on May 12, and continued increasing through the spring and summer. But this was a gradual return.

The allowance of support bubbles in June 2020 brought no significant increase in home visits, although a flattening of the rate during August 2020 may indicate that social gatherings moved to restaurants during the operation of the Eat Out to Help Out scheme, or to public outdoor areas with warmer weather. While visitation rates exceed those seen in our baseline months, we can’t tell whether these were indoors or visits to front and back gardens, nor whether the rule of six was followed.

Later national lockdowns saw higher levels of mixing compared to what we observed in March 2020. The second lockdown in November 2020 saw a 15.3% reduction from baseline on average. Activity increased quickly after the end of the November lockdown, potentially due to the run-up to Christmas. The third lockdown, in January 2021, saw around a 26.2% reduction until mid-February.

We observed a significant rise in visitation from mid-February onwards while the third national lockdown continued – within two weeks rising to 23.3% above baseline levels. This increase in activity aligns with the announcement that the UK had offered vaccinations to the first four priority groups, which may have given people confidence to return to social activities at this time.

Graph showing trends in visits to other residential areas.
In this figure, the dots represent the daily mobility data, while the orange line represents a seven-day average. Scientific Reports, Author provided

Taken together, the evidence suggests a slowly declining adherence to the stay-at-home rules as the pandemic went on. The underlying reasons for this will be multifaceted, summarised neatly as “lockdown fatigue”, but more precisely relate to increasing perceptions of safety in the face of the vaccine rollout, a need to re-engage in social activity, declining trust in government, and other personal stresses. These trends tell us we can’t simply pull the same policy leavers and expect to achieve the same outcomes as those seen in March 2020.

There is further variation in our findings when we look at different areas. In general, we observed lower levels of household visitation in rural areas, while some cities (London, Manchester and Cambridge, for example) regularly exceeded pre-COVID activity levels.

The reason for these differences is not clear. It could be linked to factors like household composition and personal circumstances, but further work is needed to better understand the complex demographic and household factors influencing these trends.

The implications

While there are some intriguing patterns of activity in this data, we must also apply plenty of caution in drawing conclusions. We can only speculate on the causes underlying the trends we observe, and the trends we see in England don’t necessarily reflect what has happened, or might happen, elsewhere.

Nevertheless, these findings add to our understanding of the impacts of pandemic policy, and highlight the need for nuance in crafting future interventions.

The patterns of household visitation we observed reflect the social complexities of the pandemic period. We must remember that household visitation does not equate to malicious noncompliance, and instead may point to the need for people to see each other for their emotional wellbeing.

While there are clear public health reasons to encourage caution in social mixing, this must be balanced against the negative outcomes of lockdowns and their potentially diminishing returns. Policy must be crafted to account for these nuances – supporting opportunities to socialise while avoiding higher risk interactions, responding locally, and adapting with the changing attitudes and circumstances faced by the population.


Ed Manley, Professor of Urban Analytics, University of Leeds and Mengdie Zhuang, Lecturer in Data Science, University of Sheffield

This article is republished from The Conversation under a Creative Commons license. Read the original article.

Masters Dissertation Scheme 2021 Awards

Data shown in gold converging into a point of light on the horizon like a sunset

Masters Dissertation Scheme 2021 Awards

Since 2012, the nationwide CDRC Masters Dissertation Scheme (MDS) has brought together masters students intent upon pursuing dissertations using retail and other industry data, their academic supervisors and industry contacts who are able to provide data or support ‘horizon-scanning’ research focused upon real world problems. The MDS now also has an active alumni network of past students to maintain and further develop industry collaborations with CDRC.

Every year, the best dissertations are showcased at an event and three prizes awarded to the best dissertations.

This year’s awards ceremony was held online, hosted by the Market Research Society’s Census and GeoDems Group, with prizes awarded by the Economic and Social Research Council’s Senior Policy Manager, Bruce Jackson.

The winner was Disa Ramadhina (MSc Business Analytics, UCL) who worked with partner Entain Group on the relationship between the use of retail shop and online gambling behaviour. Disa now works with Entain Group as a Compliance Data Analyst in their Safer Gambling team.  

Runner up Sharon Liu (MSc Operational Research with Data Science, University of Edinburgh) worked with longstanding MDS partner Walgreen Boots Alliance on enhancements to online recommender systems to personalise customer experience.

Movement Strategies has also become a regular sponsor of MDS projects and worked with our other runner up, Lu Xia (MSc Social and Geographic Data Science, UCL) on inferring transport mode using GPS data.

Disa Ramadhina

Sharon Liu
Sharon Liu

Lu Xia
Lu Xia

Our warmest congratulations to these very worthy winners, who share £1,000 in prize money. This year the MDS attracted 80 applications for the 20 projects on offer, details of which can be found in the MDS Project Archive

The Masters Dissertation Scheme 2022 is now open for proposals from industry and other partners – enquiries can be directed to Melanie Chesnokov at m.chesnokov@ucl.ac.uk

First Findings From IGD Research Trials Announced

Bowl of delicious looking fruit

First Findings From IGD Research Trials Announced

The research results from the first of our behaviour change trials working with the Institute of Grocery Distribution have been announced this week!  Further blogs from members of the team involved will follow in the next few weeks…

IGD press release

Collaboration between IGD, food and consumer goods industry and the University of Leeds helps shift people towards healthier, more sustainable diets

As part of its ambition to make healthy and sustainable diets easy for everyone, IGD is today launching the first results from its in-store behaviour change trials, testing what strategies at point of sale could shift consumers towards making healthier, more sustainable food and drink choices.

To find out what truly drives long-term behaviour change, IGD has joined forces with leading retailers, manufacturers and researchers at the University of Leeds, to put theory into practice with millions of people through a series of real-life behaviour change trials. These first results were taken from promotions across 101 Sainsbury’s stores during a four-week-period in both January 2020 and January 2021.

With 37% of consumers saying that cost prevents them from eating a healthy, sustainable diet1 , the trials tested the hypothesis: reducing the price of fruit and vegetables to 60p in stores across the country, for four weeks, should increase portions sold and variety of products purchased2 using three behaviour change levers. Sales data analysed by the team at The University of Leeds found the number of promoted fruit and vegetable portions sold increased by 78% when the price was reduced.

Susan Barratt, IGD CEO, said: “Obesity is one of the biggest health problems this country faces. Just 1% of the UK population currently meets government healthy eating guidance.3 With our diets having such a huge impact on our health and our planet, now is the time for government, the food and consumer goods industry and shoppers to take collective action. The most impactful way to make a difference is to change what we eat and drink.

“This report explores our initial findings, which already shows a positive impact through nudge tactics, pricing and product placement. This is a hugely exciting project, demonstrating the genuine opportunity our industry has to make healthy and sustainable diets easier and more accessible for everyone.”

As well as the number of promoted fruit or vegetables purchased, fruit and vegetable sales also increased beyond the items on offer. The findings show that promoted fruit and vegetable sales did decline after the promotions ended, although the rate of decline reduced year-on-year, suggesting some consumers carried their healthier eating habits forward.

Further findings from Sainsbury’s – looking at whether consumers continued to eat a greater variety of fruit and vegetables in the year after the trial – will be reported on in 2022.

IGD is leading the way and bringing industry together to collaboratively drive change by implementing the trials, with support from their research partner, the University of Leeds, through its Leeds Institute for Data Analytics (LIDA) and Consumer Data Research Centre (CDRC). LIDA is capturing and measuring sales data from each intervention to assess what levers drive long-term behaviour change to adopting healthier and more sustainable food and drink choices. With learnings from these and further trials that are underway with several UK retailers, which will be shared in 2022, IGD will recommend how industry can effectively shift consumer behaviour towards healthy and sustainable diets.

Dr Michelle Morris, who leads the Nutrition and Lifestyle Analytics team at LIDA/CDRC, said: “Using anonymous sales data at scale, over an extended period of time to understand consumer behaviours and evaluate interventions, is unique and exciting. The collaborative approach to study design, independent analysis and wide dissemination strategy means that we can share learnings across the sector to make the best changes to help consumers purchase healthier and more sustainable choices.”

Use this report to understand how, by working together, the food and consumer goods industry can drive change and trial real-life solutions to inspire others. As part of this work, IGD has also developed a hub of inspiring industry insight, bringing together a wealth of resources to help deliver change in your organisation. Visit the hub to find out why healthy, sustainable diets should be central to your business strategy and see how you can get involved.

For media enquiries please contact Sarah Burns sarah.burns@igd.com / t: 07483 094027.

  1. IGD (2021), Appetite for Change
  2. IGD, Healthy Sustainable Diets: Driving Change, Behavioural Insights Report 2021 – An adult portion of fruit and vegetables is 80g, according to Government guidance
  3. https://bmjopen.bmj.com/content/10/8/e037554

GOLIATH: Geographies of Lifestyle, Activity, Transport and Health (Case Study)

GOLIATH: Geographies of Lifestyle, Activity, Transport and Health
(Case Study)

Consumer data can provide insight in to a wide range of human activity, but there is a trade-off between privacy and utility of the data.

Project overview

Consumer data collected by commercial providers have huge potential for a range of research purposes but can be challenging to access as they are often held in secure environments. Secure handling of these datasets is crucial, as consumer data contains sensitive attributes (e.g. address) or commercially sensitive data (e.g. they have been purchased or contain licenced information). This project provides a proof of concept for creating enhanced and aggregated versions of consumer datasets for research purposes, and a dashboard for exploring those data.

Data and methods

Taking securely held consumer datasets within the Consumer Data Research Centre (CDRC), the objective of the project was to produce non-disclosive and aggregated versions of the data whilst maintaining the unique characteristics and value of those data. An R Shiny app visualising the aggregated data has been developed to showcase the utility of non-disclosive datasets for research purposes. Based on a randomised sample of Whenfresh/Zoopla consumer data, key matrices such as median price and affordability are calculated for different property types at the Middle Layer Super Output Areas (MSOA) level. Additionally, open data is used to calculate further metrics, for example, the attractiveness of an area based on Census flow data. The next steps include improving the efficiency, loading and updating times of the R Shiny app so that it can be populated with additional datasets.

Key findings

Using existing data, especially anonymised and aggregated consumer data, this research project can be seen as a proof of concept for an ‘alternative’ or ‘big data’ census. Different data types, e.g. time series, static, and origin-destination flow data, have successfully been combined and can be explored by the user in a dashboard (Figure 1).

Figure 1 – Screenshot of GOLIATH dashboard

Value of the research

The prototype R Shiny app forms the basis for further work in providing a dashboard for exploring local area statistics. Moving forward, other consumer data could be included as part of GOLIATH, for example, transport and lifestyle datasets. Utilising consumer data in addition to traditional census counts contributes to efforts to create an ‘alternative’ or ‘big data’ census.

Insights

  • Devised methods for the aggregation and calculation of metrics for secure consumer data
  • Developed a prototype R Shiny App for the visualisation of spatially disaggregated information

Research theme

Urban analytics

People

Maike Gatzlaff
LIDA Data Scientist Intern

Dr Nik Lomax
Co-Director of the Consumer Data Research Centre

Professor Mark Birkin
Co-Director of the Leeds Institute for Data Analytics

Dr Will James
Research Fellow, University of Leeds

Partners

The Consumer Data Research Centre

Funders

The data for this research have been provided by the Consumer Data Research Centre, an ESRC Data Investment, under project ID CDRC [Project Number], ES/L011840/1; ES/L011891/1.

Measuring Ambient Populations during COVID-19 (Case Study)

Graph showing footfall data results

Measuring Ambient Populations during COVID-19 in Leeds City Centre
(Case Study)

The COVID-19 pandemic led to lockdowns being implemented all over the world, including in the UK.  The aims of the project were to investigate relevant data sources for modelling the ambient population of Leeds City Centre during COVID-19 and analysing the impacts that lockdown policies had on urban footfall.  The research builds on previous work undertaken with Leeds City Council by intersecting key dates from the English lockdowns and integrating these into machine learning models to assess the importance of different aspects of lockdowns. It also predicts what “business as usual” may have been like had there been no pandemic.

Analysis notebooks and scripts can be accessed at https://github.com/tbalbone31

Data and methods

Leeds City Council have been collecting footfall data for more than a decade. The data were wrangled and aggregated to create a history going back to 2008.  These data were then analysed alongside key lockdown dates to determine where trends in urban footfall intersected, raising questions about what aspects of these policies might have had the most impact.  The data cover a relatively small geographical area of Leeds City Centre and only reflect pedestrian traffic going past the locations identified by the cameras.  There are issues with data quality, such as potential double counting, periods of time with missing data and inconsistent file formatting, however it covers a large temporal scale and many problems can be worked around.

Google COVID-19 Community Mobility data was analysed as a potential alternative data source to the Council data.  It shows changes in mobility from a baseline for six different destinations (see the website for more details).  The smallest relevant spatial coverage is the Leeds City Region.  This was considered too large to isolate any changes impacting the city centre, making comparison of trends difficult.

The Council footfall data were resampled to show daily counts on which analysis was then conducted.  Visual analysis was undertaken to identify footfall trends over the course of the pandemic against key dates pertaining to the implementation and lifting of certain COVID-19 restrictions. These key dates were decided from research into when major legislation came into force or government announcements about restrictions were made.  The questions generated from initial analysis were then explored by creating a series of machine learning models using Random Forest Regression in the Python SciKit Learn package. 

The first model included a series of input variables to represent different aspects of society that had restrictions placed on them alongside other external conditions (such as weather, school/bank holidays, day of week, etc).  Variable importance was used to identify what (if any) aspects of lockdown might be significant in predicting future changes in footfall. The second model omitted any lockdown related inputs and was designed to make predictions on what “business as usual” might have been like had the pandemic not happened. 

Due to the inherently ordered nature of time series data, both models were validated using a method known as “Walk-Forward Validation” instead of the default Cross-validation included in SciKit Learn and often used on Random Forest Ensembles.  The implementation of Walk-Forward validation allows the model to be retrained after every prediction on the validation dataset, essentially “walking forward” through the time series.  This avoids potential data leakage because of the randomised nature of Cross-validation.

Key findings

The chart below shows the resampled footfall data intersecting with key dates from COVID-19 restrictions.

Key dates are shown as a dotted line with a number relating to a key.  Red zones indicate “official” lockdowns whilst orange represents periods where a variety of restrictions were in place but in the process of being lifted/introduced individually.  A summary of how this impacted footfall is below:

  • Footfall started to drop immediately after the announcement on 16th March 2020, no official restrictions implemented.
  • After non-essential shops and schools reopened on 15th June 2020, footfall started to rise again.
  • Footfall continues to rise through summer until around 22nd September 2020 when some restrictions were announced.
  • Footfall rises whilst Leeds is in tier 2 and 3, potentially because gatherings are only permitted in public spaces.
  • The second and third lockdowns drive footfall back down again until restrictions begin to ease again in April 2021.

The first machine learning model was intended to explore whether any lockdown variables would be significant in predicting future changes in footfall.  Variable importance (top 10) is shown below.

The most important lockdown-related features were indoor entertainment and non-essential retail.  Whilst this is only an initial model and not a definitive conclusion, it does help indicate what aspects of lockdown might have impacted pedestrian traffic in the city centre more than others.

The second model was designed to test how useful the data would be in predicting what “business as usual” may have been like.

There was little difference between error scores across different numbers of trees, so a compromise of the best score and least processing power (500 trees) was chosen.  The model predictions using this hyperparameter are shown below.

Results from this initial model are by no means definitive, however the potential to quantify how much footfall has been lost exists.  For example:

  • Average daily footfall in the lead up to Christmas (taken as 30th November to 24th December 2020) was approximately 36% lower than predicted.
  • Average daily footfall over the school holidays was approximately 63% lower than predicted.
  • Approximate footfall loss for individual Bank Holidays was also calculated.  Most recorded over 90% lower than predicted values except for the August Bank Holiday which was around 22% lower.

Value of the research

Initial analysis has already been delivered to Leeds City Council.  An aggregated dataset of footfall camera data has been created and is available on the Consumer Data Research Centre (CDRC) Data Store for future research.  The initial models developed can be used and refined by future researchers and develop more accurate predictions, whilst more specific time series packages can be explored.

Insights

  • Urban footfall and ambient population was significantly impacted by COVID-19 lockdown policies (as was intended).
  • Closure of Indoor Entertainment and Non-Essential retail appear to be the most important lockdown-related factors in predicting footfall change.
  • Consideration must be given to how time series data is processed in classic machine learning models such as Random Forests.

Research theme

Urban analytics

People

Tom Albone – Data Scientist Intern (LIDA)

Dr Nick Malleson – Professor of Spatial Science

Professor Alison Heppenstall – Professor in Geocomputation

Dr Vikki Houlden – Lecturer in Urban Data Science

Dr Patricia Ternes – Research Fellow

Partners

Leeds City Council

Funders

Consumer Data Research Centre

Data News: County Court Judgements (new dataset available)

Maps showing research outputs

Data News: County Court Judgements (new dataset available and potential project ideas)

With our data partner Registry Trust, CDRC can provide access to data on County Court Judgements, which offer a key measure of financial health, both at an individual level, and also at an area and country level. The data are available County Court Judgements, either at an aggregated level (MSOA and Local Authority District) as a Safeguarded product or aggregated to LSOA level and at individual Judgement level as a Secure data product.

These data can be used as input data to a wide range of analyses looking at financial health and a range of other factors. Millie Corless, Data Analyst at Registry Trust, works with these data and performs a wide variety of analyses. However, she only has limited time available to analyse these data, so there are many more potential projects that could be done, with some examples listed below and on the data page.

Prior to working at Registry Trust, Millie completed her masters dissertation through the CDRC Masters Dissertation Scheme (MDS), working with the Registry Trust, which gave her the time to analyse the data in new and interesting ways. Millie is very interested in health and she looked at the CCJ data and explored its relationship with health.

Her dissertation project assessed geographic and temporal patterns in consumer (individual level) County Court Judgment (CCJ) rate (as an indicator of financial vulnerability), and considered the extent to which general health influences personal financial vulnerability across England and Wales. The project then considered the influence of additional socio-economic variables, such as Tenure and Employment Status, on financial vulnerability. The outcomes highlighted spatio-temporal locales where specific socio-economic variables influence financial vulnerability more, thus where the implementation of health improving policy will tackle the instability. More details available on her blog post.

There are a number of potential topics listed on the CDRC Data page that could be undertaken with CCJ data. These would make a good Masters Dissertation project (Registry Trust will be offering projects through the MDS) or you are welcome to apply to access the data and complete a different project independently.

Potential projects could include:

  • Work on a way to derive and publish a set or range of economic health indicators
  • Predict the future trend of these economic health indices
  • Use data to highlight exceptions and process inefficiencies in public sector entities e.g. exception reporting on court timelines, outcomes that are outside expected benchmarks, highlighting court inefficiencies, bottlenecks or process flaws
  • Improve existing data accuracy and gaps, e.g. impute missing or inaccurate data
  • Explore issues around CCJs and fraud – tackle the myth of the ‘unsound’ CCJ
  • Look at the effect of politics on indebtedness – what relationships are there between Government, national political representation, local representation and indebtedness?
  • Develop the Financial Stress Tracker produced by Registry Trust, to include the self-employed, those on low income, those who have been impacted by COVID and other factors.
  • Focus solely on Scotland or Northern Ireland, as these regions have had less focus at Registry Trust.
  • Get a closer insight into those taking out a judgment, for example which are the most forthright? Why might this be? Are there spatial or temporal trends?

If you are interested, or would like more information, please either reach out to Millie directly (m.corless@registry-trust.org.uk) or email CDRC (info@cdrc.ac.uk).

The CDRC Research Review 2020-21 is GO!!

The CDRC Research Review 2020-21 is GO!!

The CDRC is made up of numerous researchers from a range of different disciplines, faculties and organisations.  There are constantly multiple research projects in progress.  In fact, there’s always so much great work going on that it’s hard to keep on top of what’s happening!

Cue the CDRC Research Review 2020-21, where we’ve brought together many of the projects our researchers have been working on in the last couple of years. 

Take a look for yourself at what we’ve been doing in the areas of:

Population movement in Greater London during the first lockdown

Population movement in Greater London during the first lockdown

Researchers from UCL Geography with the Consumer Data Research Centre (CDRC) have published a new study that uses smartphone location data to explore activity patterns in Greater London during the first lockdown.

Professor James Cheshire and PhD researcher Terje Trasberg used anonymised smartphone data from over 300,000 devices to measure population mobility from the early period of the pandemic last March to the easing of the first lockdown last summer.

The study aimed to identify socioeconomic characteristics that could explain the differing rates of decline in population movement across neighbourhoods.

(Credit: Mary Hinkley)

Their analysis revealed the division between areas dominated by white- and blue-collar jobs, the latter showing a much smaller reduction in activity during the lockdown.

This finding highlights a divide between those who can work from home and those with jobs that must be carried out on-site. This has important implications for transport, retail and post-COVID-19 recovery policy.

Terje Trasberg said: “By linking the mobile location data to the broader demographic characteristics, we were able to provide additional insights into the impacts of mobility restrictions in different demographic groups across Greater London.

“We hoped that our analysis can offer a more nuanced insight into why the effectiveness of social distancing interventions appeared to vary between areas. The data also signals those areas likely to require the most support during a post-pandemic recovery phase as activity is slower to return.”

For more information on the study, read the CDRC’s data story. The full study can be accessed here.

(First published at www.geog.ucl.ac.uk/news-events/news/new-study-explores-population-movement-in-first-lockdown, written by Samuel Kelly, Communications & Marketing Officer, UCL Geography)