Masters Dissertation Scheme 2021: another fantastic year of projects!
A record number of students from UK universities applied to the Masters Dissertation Scheme (MDS) this year. Of more than 80 applications, a total of 20 students were selected to partner with 15 organisations for their 2021 Masters dissertations.
Real-world data was used across a range of issues to produce innovative research in areas from loyalty card and gambling harm data to housing, social media, health, retail, transport, construction and the justice system.
Abstracts for each dissertation can be found on the Project Archive page. Five students have also recorded videos, talking about their experiences of the Scheme.
The range of subject areas covered gives the MDS a broad appeal and applications were received from students studying across numerous diverse disciplines, ranging from Business Analytics to Sustainable Urbanism, and Spatial Data Science to Logistics and Supply Chain Management. Applications also came from a wide range of UK universities including Bristol, City, Edinburgh, Glasgow, Leeds, Liverpool, Loughborough, Nottingham, Oxford, UCL and Westminster.
Congratulations to all of this year’s students, and special thanks to the sponsors and academics who supported the 2021 Scheme.
For enquiries about the Masters Dissertation Scheme, or to discuss next year’s Scheme, please email [email protected]
Background to the CDRC Masters Dissertation Scheme
In 2012, ESRC funding allowed for the establishment of the first MDS. Following its success, the MDS has continued to be funded annually, with ESRC funding used alongside business co-funding to sponsor Masters degree dissertations that address business horizon-scanning topics.
Proposals from business sponsors are sought during the first term of Masters courses and are posted on the CDRC website. Any interested Masters students studying at a UK institution are invited to apply for proposals from February 2022 (second term of the Masters). Dissertations are conducted by postgraduate students and are co-supervised by academics and business analysts from the sponsoring organisation.
Although funded initially on an ad-hoc basis, and subsequently subject to short term renewals of CDRC funding (such as under the World Class Labs’ funding stream), the Scheme has proven remarkably successful, with a total of 76 dissertations completed with external organisations to 2020 and a further 20 dissertations completed in this year’s very successful annual round (2020-2021 intake).
Our LinkedIn network brings together a network of 90 students, sponsors and academics who have been involved in the Scheme over the past years. CDRC alumni and friends are invited to join here: www.linkedin.com/in/cdrc-alumni-group-1613a31ba/.
Past MDS alumni work in a range of sectors worldwide, including retail, banking, hospitality, logistics and academia.
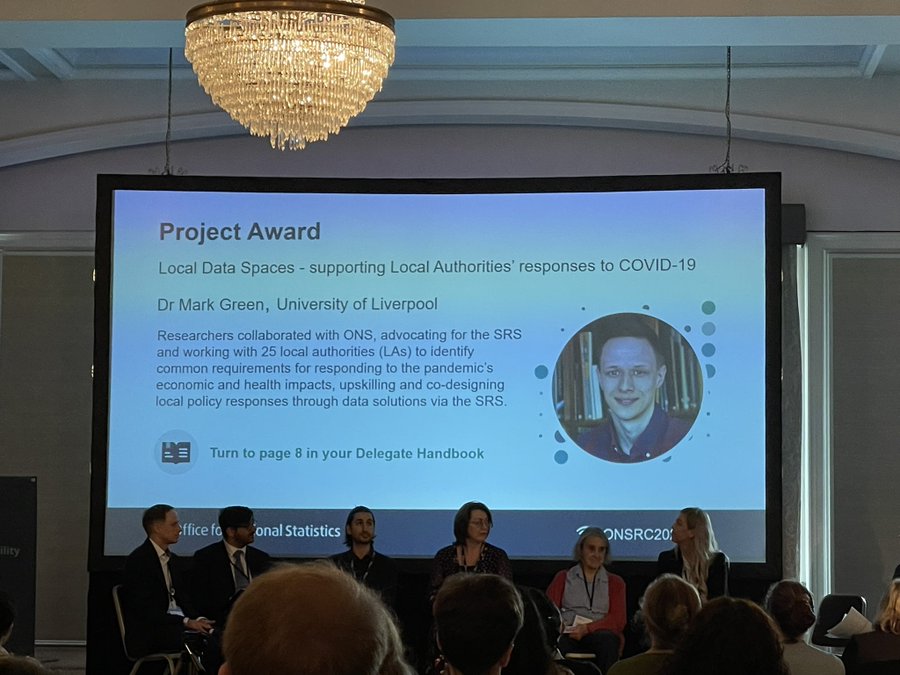
The CDRC’s Local Data Spaces project has been chosen as the winner of the prestigious ONS Research Excellence Project Award 2021 from the 400+ projects who used Office for National Statistics (ONS) data this year! This award recognises innovative research that has delivered public good or informed policy decisions.
The Local Data Spaces project combined ONS datasets with the CDRC’s own consumer data, creating ten innovative reports for each English Local Authority. These reports delivered highly tailored insights about how their communities were affected by the pandemic, which could then help to shape policy strategies.
For example, in Liverpool, the reports identified that sections of the community with low confidence in using internet technologies were less likely to make use of lateral flow tests. This led to local efforts to promote testing beyond social media, feeding these insights into the national roll-out of lateral flow testing that helped re-open workplaces and schools following the January lockdown.
In Norfolk, the analysis shows that furloughed workers were three times more likely to have caught COVID-19 than individuals who were employed or self-employed, suggesting that more could have been done to prevent COVID-19 outside of workplaces. A similar pattern was observed in most places nationally.
The project also found that, across England, COVID-19 did not significantly vary between men and women within different work sectors or occupations. One exception was the higher rate for COVID-19 in women employed in personal services jobs (e.g. hairdressers, barbers, cleaners, beauticians) at the start of the second wave. Findings from this work were presented to SAGE (Scientific Advisory Group for Emergencies) to help inform national policy around gender inequalities.
“The pandemic has shown the importance of getting the right data into the right hands,” said Dr Mark Green, lead researcher. “Local Data Spaces has opened up new sources of data to local authorities and helped them proactively respond to COVID-19.
“We are honoured to receive this prestigious ONS award. I am really proud of how our team worked at pace to support urgent policy needs during a global crisis.”
Professor Alex Singleton, CDRC Co-Director, added: “The strategic ESRC funding enabling the Local Data Spaces project perfectly illustrates the value and impact that can be unlocked by the social sciences when integrating consumer and government data within trusted research environments.”
Each of the 10 reports for all Local Authorities across England are freely available from the CDRC website and tackle a variety of themes related to the local impacts of COVID-19, from demographic and occupational inequalities, through excess mortality, to economic vulnerabilities.
When the COVID-19 pandemic struck, already strained Local Authority resources were stretched even further, with infection and transmission of the virus exacerbating existing social inequalities.
In order to support the response of local authorities, groups and stakeholders to COVID-19, the Local Data Spaces (LDS) project was set up – a collaboration between the Consumer Data Research Centre (CDRC), the Joint Biosecurity Centre (JBC), the Office for National Statistics (ONS) and ADR UK.
What did the project involve?
During the six-month project, our research team engaged with 25 local authorities to better understand local priorities, contexts and research needs. From the meetings with local stakeholders, the huge variation in resources available for research and analytical capacity became clear.
Two core research priorities were identified which focused on broader COVID-19 health impacts and inequalities, and economic vulnerability and recovery potential.
With local authorities working alongside the research team, we developed relevant and useful reports and helped fill evidence gaps at local levels. Using data from the ONS’s Secured Research Service (SRS), we generated a series of ten reports, specific to each local area, investigating themes including demographic and ethnic inequalities in COVID-19, excess mortality, economic vulnerabilities and human mobility.
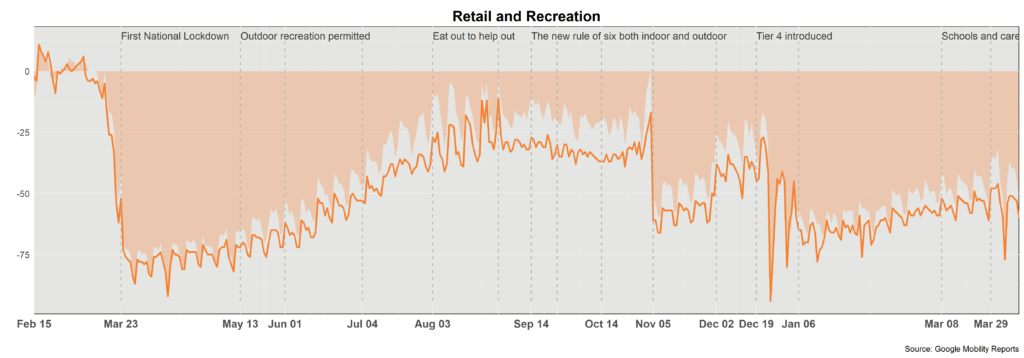
One report output, comparing changes in retail and recreation over time for the country (area) and local authority (line).
What data was used?
The ONS’s Secured Research Service includes core national data products such as NHS Test and Trace, the COVID-19 Infection Survey, the Business Structure Dataset (BSD) registry and the Business Registry and Employment Survey (BRES). These data sources were supplemented where relevant with openly available datasets such as the ONS Population Estimates, Google Mobility Data, and CDRC open data products such as the CDRC Business Census, and Access to Healthy Assets and Hazards (AHAH).
How does this project help?
Apart from profoundly important data analysis, the reports provide a number of practical efficiencies with all of the processes required to prepare datasets already completed – vital if local authorities do not have the analytical resources or time to undertake the work themselves. The reports also allow access to high-quality datasets that they may not have access to otherwise.
Through the series of reports for each local authority, we sought to paint a picture of the impacts of the pandemic, and also provide regional and national level comparisons where possible to highlight the relative local level impact. Local authorities are now quickly and succinctly able to uncover the local impact COVID-19 has had across a range of health, human mobility and economic themes in their own regions.
Smartphone apps and activity – tracking trends in who, how and when we move
The advantages of being physically active have never been more apparent, with proven benefits across a wide range of health conditions. Traditionally, we might consider the beneficial role of physical activity to be in reducing obesity incidence and preventing non-communicable diseases, such as cardiovascular disease and type 2 diabetes. However, the COVID-19 pandemic has thrown further positives into the spotlight, as being physically active has been shown to reduce the risk of severe COVID-19 outcomes. Moreover, lockdowns and state-sanctioned time for exercise highlighted the importance of physical activity to mental health and wellbeing.
Physical inactivity is responsible for 1 in 6 deaths in the UK (equivalent to the risk from smoking1), with 1 in 3 men and 1 in 2 women not meeting the recommended 150 minutes of moderate to vigorous activity a week1. To reduce physical inactivity, we need to identify and remove the barriers to being active. These barriers are diverse and wide ranging, varying from person to person. Examples include, but are not limited to: increasingly sedentary occupations, time or monetary constraints and environments that do not support activity.
To best identify what and where these barriers to being active are, we need to establish a good understanding of where, when and how people are active. However, studies investigating physical activity behaviour are typically limited by sample sizes, small study areas and shorter study durations.
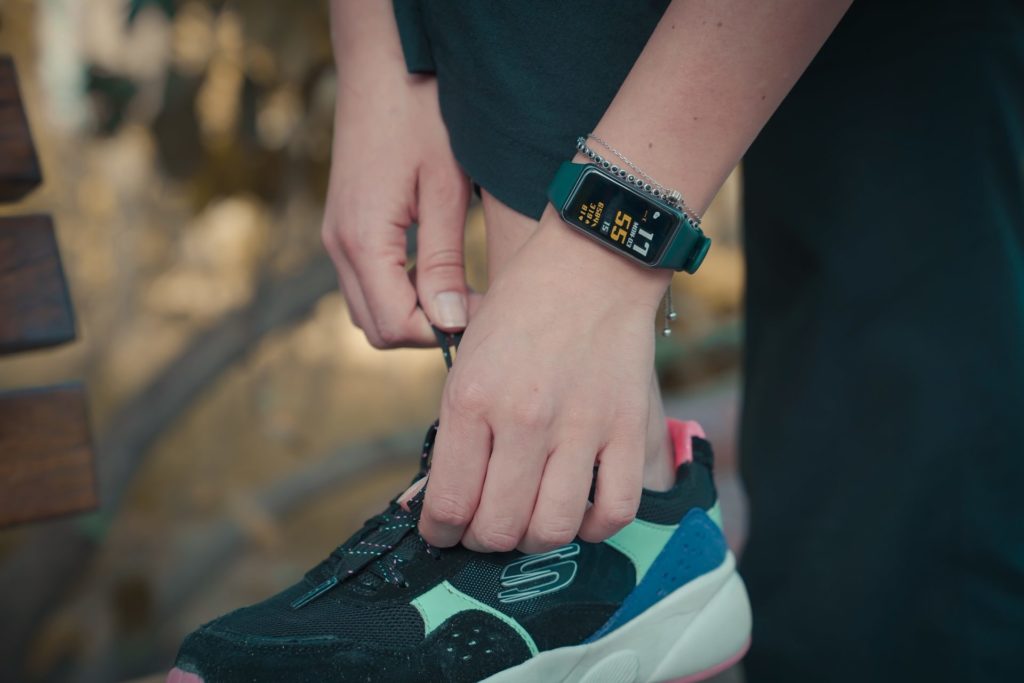
Increasingly, individuals are monitoring their own activity and fitness levels using smartphone apps or wearable trackers such as Fitbit, Garmin or smartwatches. Secondary use of these consumer data can provide researchers with new insights into physical activity behaviour. In this research, we use secondary app data provided by FUELL Ltd‘s Bounts app (available for use by researchers via application to the CDRC). We evaluate how useful secondary smartphone data are in providing insight into how active the public are. To do this, we first need to assess how representative app users are of the population as a whole. Finally we uncover key activity behaviours associated with different age and gender user profiles.
The app – who is using it?
The Bounts app was commercially available on all major app provider stores, with users earning points for activities which could later be exchanged for vouchers and prizes. All user data is pseudonymised and no identifiable user information is shared with the researchers. Additionally, data is only accessible to those with data security training and in a data secure environment.
We used the data of 30,804 app users who recorded seven or more days of activity in 2016. With an average user age of 39, women make up a significantly larger proportion of app users (77.7% of users). 43.8% of users provided a postcode district which we linked to the Office for National Statistics socioeconomic classification. Unlike traditional studies, which tend to underrepresent lower socio-economic groups, we found there was no substantial socioeconomic difference in the areas where Bounts users lived compared to the general population.
Research highlights
Seasonal and weekly trends in physical activity behaviour
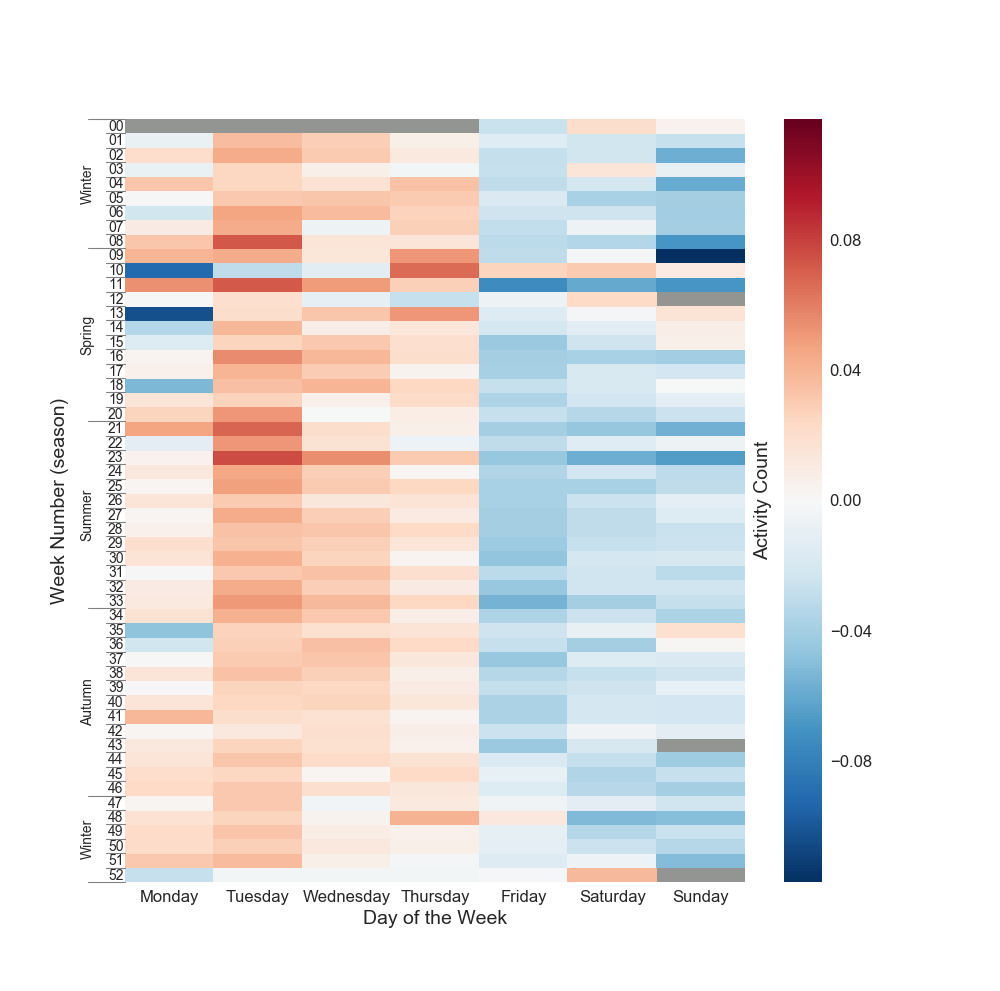
Users recorded on average 218 days of activity, which is substantially longer than the typical seven-day data collection period in traditional physical activity studies. Thanks to this long monitoring period, we were able to observe distinct patterns in activity behaviour across weekly and seasonal timeframes.
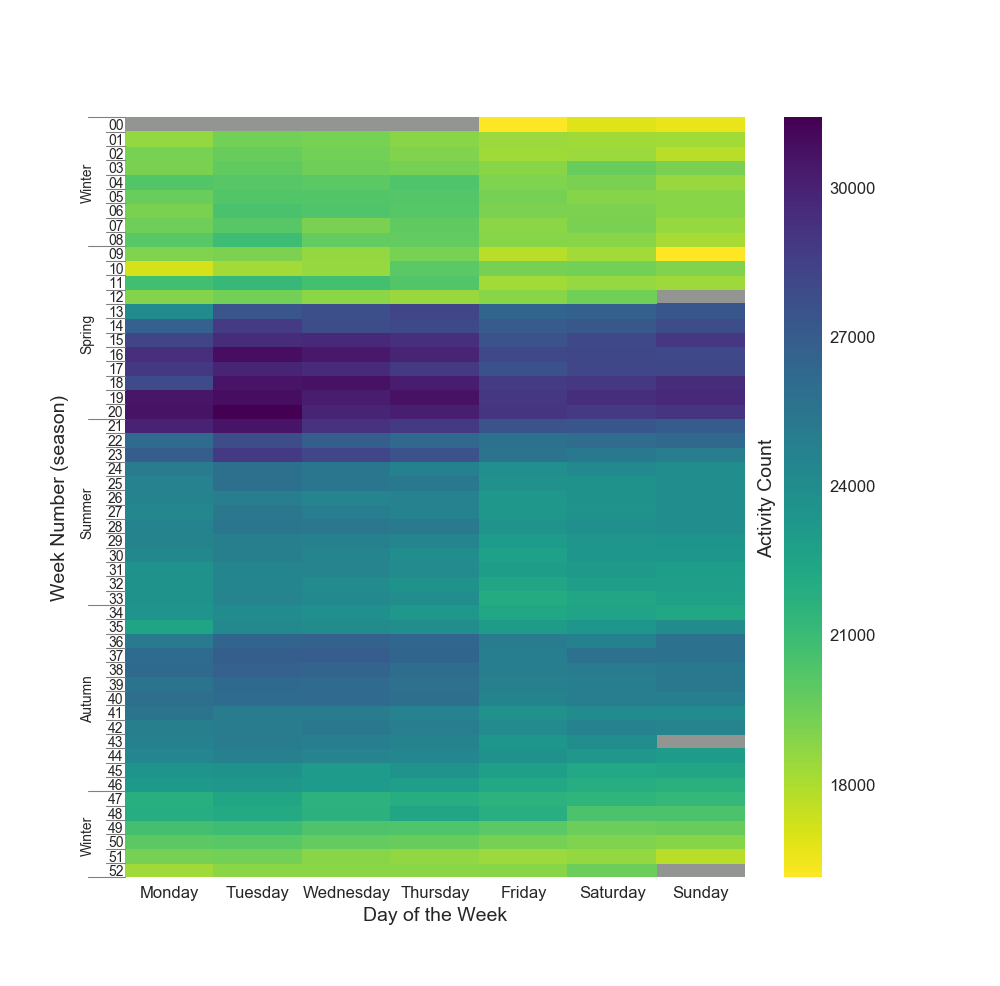
Across the year, we can see the role daylight saving plays, with a higher number of activities recorded by users over the summer months when evenings are longer, dropping off in autumn as the days get shorter (Figure 1).
Figure 1 – Seasonal trend heatmap of total daily activity recorded by all app users
Figure 2 – Heatmap of total daily activity recorded by all app users standardised by week, highlighting weekly patterns of behaviour
We can also see a weekly pattern in activity behaviour with the highest number of activities recorded mid-week, peaking on Tuesdays (Figure 2). Higher weekday activity levels are suspected to be functional activity around commuting behaviours. This goes against the ‘weekend warrior’ theory that individuals tend to exercise more on the weekends and less on weekdays.
A higher level of functional activity is associated with women and those in less affluent socioeconomic groups. This corresponds to our user sample which has a high proportion of women and captures users from less affluent socioeconomic groups, who are usually underrepresented in physical activity studies.
Who is meeting the physical activity guidelines?
For each week that a user recorded activity, we calculated whether the culmination of this activity was enough to meet physical activity guidelines of 150 minutes of moderate to vigorous activity per week. This includes any activity with greater or equal intensity to brisk walking.
Despite the known health benefits, the overall proportion of weeks meeting these physical activity guidelines was low. The youngest and oldest users were the least likely to meet the guidelines, with those aged 35 to 44 most likely to meet the sufficiently active threshold.
Men were almost twice as likely to meet the guidelines, with 24.2% of weeks recorded by male users classed as adequately active compared to 12.4% of weeks recorded by female users. Additionally, living in the most affluent area compared to the least affluent (in terms of employment), improved the odds of recording an active week by almost 5%.
How useful are secondary smartphone data?
Secondary smartphone data are an invaluable tool to provide new insights into physical activity and other health behaviours, as they give a breadth and depth of detailed data not available from other methods.
On the flip side, using these data requires careful consideration, including meticulous implementation of data anonymity and ethics, attention to data handling and cleaning processes, and skilled training to be able to handle such a large detailed dataset. Used in tandem with more traditional primary data collection studies, secondary smartphone app data have the capability to address some of the most complex questions around physical activity behaviour. We are still very much in the infancy of using these data and have just scratched the surface of their full potential.
Palatable change from the pandemic – a new food environment?
Naturally, we are all concerned about our own and our family’s health and, with the rising issue of climate change, many of us are becoming increasingly worried about the health of the planet too. While living a healthy and sustainable lifestyle is becoming a common goal, there are many barriers to making this aspiration a reality [i].
Eating a nutritious diet that minimises environmental impacts is the most important step we can personally take towards this…but what is a healthy and sustainable diet? Looking at our current consumption in the UK, a shift towards a more plant-based diet would be mutually beneficial for ourselves and the planet.
Please note that the plant-based diet we refer to does include meat and animal products, alongside a larger designated portion of vegetables, fruits, pulses and legumes.
The government’s current dietary recommendation from the Eatwell Guide is one example of a sustainable diet consisting considerably of plant-based products. We have, therefore, chosen the Eatwell Guide as our ‘healthy and sustainable diet’ model to shift behaviours towards.
Many organisations are also becoming increasingly aware that change is necessary and are working to facilitate a shift towards healthier and more sustainable diets [ii] [iii]. The National Food Strategy recently released ‘The Plan’ – an independent review for the Government on the English food system, which has drawn attention from researchers, retailers and policy makers alike.
I was among those eagerly awaiting the report, as here at the CDRC we’ve recently announced our partnership with IGD, which will involve investigating strategies to promote healthier and more sustainable dietary choices.
As an innovative hub utilising consumer data for academic research purposes, such a timely focus for a CDRC partnered project emphasises the reality of the issue we are trying to tackle, along with heightening people’s awareness of the changes we need to imminently make.
Healthier and more sustainable baskets
A number of leading UK retailers and manufacturers have designed a series of pilot interventions as part of IGD’s Healthy and Sustainable Diets Project Group, such as promotions on plant-based burgers or putting healthier options in prime in-store locations. Our team of researchers are assessing which interventions are particularly successful at encouraging consumers towards healthier and more sustainable choices.
Our analysis will study purchases by basket, not the individuals buying them, so all data is anonymised and not traceable back to any customer. Looking across baskets of goods allows us to observe any unintended consequences of the trial: by discretely upping the fruit and vegetable content of our diet towards the recommended third (39%), does it also inspire a reduction in meat or dairy purchases, or any foods high in fats, salts or sugars?
COVID-19 has inadvertently affected many aspects of our lives, from one lockdown to the next. Shopping habits had to change with the Government’s advice to go to the supermarket less frequently and shop local whenever possible. Many of us also experienced first-hand the reduction in pollution levels when travel was restricted, raising awareness of the importance of making more sustainable lifestyle choices.
Consumer data enables insight into how people’s shopping frequency and habits have changed over this time. Evaluating IGD interventions relies upon analysing the retailer’s transaction data across the 12-week intervention period, along with the 12 months prior and post start date. However, as I’m sure we can all agree, the last 12 months have not been a usual year. This research, therefore, requires a longer period of pre-intervention data (one additional year that also predates COVID-19), and additional analytical approaches to account for this unprecedented time and produce meaningful findings.
Our approach
Firstly, observing changes in supermarkets (such as explicit guidance on one-way shopping routes, one designated shopper per household and an increase in online shopping), our expectation is there will be less variability in the data (i.e. less variety of items in baskets/between shops), with people’s purchases becoming more habitual. It also means in-store cues, such as promotional signposting, may not be as effective as usual with restricted mobility within aisles.
Mindful of the shift to online shopping for many customers, transaction data will be studied across all online purchases as well as in-store.
A key feature to establish about the data, before generating any statistics on shifting behaviours, is gaining a sound understanding of the sample – how representative is it? IGD interventions are trialled at multiple store locations of differing regions and degrees of urbanisation to capture generalisable results for consumers in the UK. Data is also available for matched control stores (with direct regional and demographic comparisons) to control for any changes over the pandemic period, and enable observation of the impact of the intervention rather than local lockdowns.
To counter unusual shopping patterns during the pandemic, with many people purchasing ‘local’ for certain items, we will investigate behaviours within the ‘most loyal’ subset of consumers.
It is also important to look at socio-economic profiles for purchasing patterns. Understanding if certain promotions are more successful with particular demographic groups – for example, men compared to women, or in those living in deprived compared to affluent areas – is crucial. This type of comparison is more important than ever as we know that COVID-19 has hit the poorest the hardest, exacerbating socio-economic inequalities [iv] [v] [vi].
A time for change
Attitudes to food have also changed within the last year. As people spent more time at home, lockdown became a time of culinary experimentation for some, or a struggling time of increased food insecurity for others.
Although experiences of the pandemic have drastically differed, it has been a time of change collectively. For a significant period, food shops were one of the few areas designated essential by the government. People have come to associate choices about their food with an opportunity to take control of something, in a context where other choices have been suspended.
Many people have changed their shopping and cooking habits during this period. We have seen organisations recognise this through the provision of cooking packs and recipe cards at both the value and luxury ends of food retail outlets. Adapting constantly to new legislations and restrictions, our lives are ever changing as the pandemic continues. While we are still changing our culinary behaviours, perhaps this is one opportunity to create a positive outcome and help nudge people towards healthier and more sustainable choices.
Despite analysis being slightly more complex in light of COVID-19, as a result people could be more receptive to IGD interventions. Our hope is that our research will uncover strategies to help retailers and manufacturers take a leading role in anchoring new, positive behaviours that become permanent habits for the wider public.
Alexandra Dalton is a Data Scientist enrolled on the Leeds Institute for Data Analytics internship programme, having graduated from the University of Leeds with a Masters in Mathematics, which included a year of study at the University of Adelaide. She is currently working in collaboration with IGD, major retailers and UK manufacturers as the lead analyst from the University of Leeds team to evaluate strategies to promote healthier and more sustainable dietary choices. Alexandra is keenly interested in sustainability, nutrition and lifestyle analytics, hence enjoying the insights made possible by consumer data to the intersectional field of nutrition and behavioural science in her current research.
[iii] Institute of Grocery Distribution (2020). IGD’s Healthy and Sustainable Diets Project Group. [Accessed online via: https://www.igd.com/articles/].
[iv] Barker, M., & Russell, J. (2020). Feeding the food insecure in Britain: learning from the 2020 COVID-19 crisis. Food Security, 12(4), 865-870.
[v] Power, M., Doherty, B., Pybus, K., & Pickett, K. (2020). How COVID-19 has exposed inequalities in the UK food system: The case of UK food and poverty. Emerald Open Research, 2.
[vi] Blundell, R., Cribb, J., McNally, S., Warwick, R., Xu, X. (2021) Inequalities in education, skills, and incomes in the UK: The implications of the COVID-19 pandemic. [Acessed online via: https://ifs.org.uk/ ]
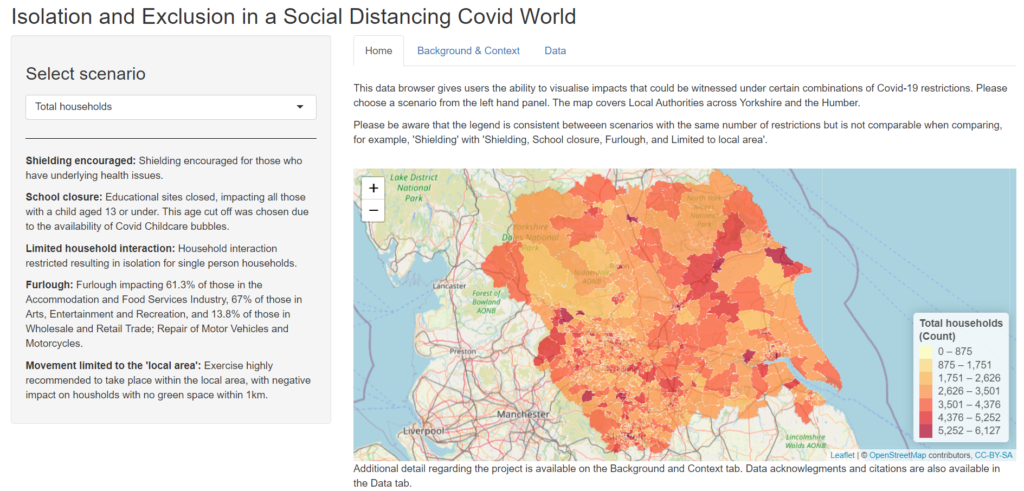
Isolation and Exclusion in a Social Distancing COVID-19 World (Case Study)
CDRC Data Scientist Intern, Rosalind Martin, working with Professor Susan Grant-Muller, Professor Alison Heppenstall and Dr Vikki Houlden from the University of Leeds, and Professor Rachel Franklin from the University of Newcastle, has produced a dashboard that identifies geographical areas which might experience increased isolation and exclusion as we leave the COVID-19 pandemic and lockdowns.
Project overview
Although much work has already been completed which identifies individuals most at risk from health impacts of the COVID-19 pandemic, there is considerable uncertainty regarding which societal impacts will persist as the UK leaves COVID-19 lockdowns. This project was undertaken with the aim of advancing the understanding of the social and spatial impacts of emergence from lockdown, particularly understanding how previously implemented restrictions will have impacted individuals and households. Using SPENSER, a synthetic population, we have identified individuals and households at risk from five COVID-19 restrictions: shielding, school closures, limited household interaction, furlough and limited to local area, along with households at risk from unique combinations of these five scenarios. This has been translated onto a dashboard which displays additive counts of household level impacts at the Middle Layer Super Output Area (MSOA) level.
Data and methods
We applied five COVID-19 restrictions (that cover a breadth of socio-economic impacts) to individuals and households across Yorkshire and the Humber. Our population came from SPENSER, a synthetic micro-population, along with additional characteristics obtained from supplementary datasets. The criteria for an individual or household to be impacted by each restriction were influenced by external statistics and are as follows:
Shielding: a randomly extracted 4.83% of the population who had been classified as in poor health, based on answering that their day-to-day activities were limited a lot due to a long-term health problem or disability in the 2011 census. The ailing population is representative of MSOA level trends and split into four age categories (0-15, 16-49, 50-64 and 65 and over).
School closure: households with at least one child aged 13 or under. This age was chosen as it is the age cut-off for forming a COVID-19 ‘childcare bubble’.
Limited household interaction: all single-person households as determined by a household size of one (a pre-existing characteristic in the SPENSER data).
Furlough: the proportion of individuals working in (1) Accommodation and food service activities, (2) Arts, entertainment and recreation, and other service activities and (3) Wholesale and retail trade, repair of motor vehicles and motorcycles industries, were identified at the MSOA level from 2011 census data and replicated proportionally in our SPENSER population. The average percentage of furloughed employees was then identified. These were 61.3%, 67% and 13.8% respectively.
Limited to local area: all households who live in an MSOA where there is no accessible green space within 1km. These data were from CDRC’s Access to Healthy Assets and Hazards dataset.
Once all the restrictions had been applied to the households, each household was assigned to a scenario which represented a unique combination of all of the five restrictions. There were 32 scenarios in total. This enabled additive counts of impacts on households to be calculated. These final outputs are displayed on the accompanying dashboard. Counts of household impacts are displayed alongside total household counts for each MSOA and Indices of Economic Insecurity, produced by Smith et al. (2020) and used with permission.
Front page of the Isolation and Exclusion dashboard
Key findings
This project has resulted in the development of an interactive dashboard, showing counts of household-level impacts at the MSOA level for Yorkshire and the Humber. Although patterns of household-level impacts are difficult to see from these maps, this work has explored how to use proxy data in order to identify individual- and household-level impacts from COVID-19 restrictions, and begun to unpack the complexities of combining data at the household level. This is something that must continue going forward as academics and policy makers continue to face the challenges that accompany understanding the social and spatial impacts of the emergence from lockdown.
Through this work, it has become apparent that certain COVID-19 specific datasets do not exist yet (such as the uptake of ‘support bubbles’) so assumptions have to be made on the extent of impacts. This detail should be added in to future tools when possible. Where data do exist, they are often lacking spatial resolution and so it has to be assumed that patterns have coarse geographies. This detail should be added in to future predictions when possible. Going forward, work must utilise more specific and detailed datasets.
The use of SPENSER as a micro-population has been foundational to understanding the impact of restrictions on individuals and households. It is recommended that any work going forward on this matter also uses small area population data as without it, any patterns of social and spatial impacts of emergence from lockdown will be coarse from the start.
Value of the research
The COVID-19 pandemic, with its associated lockdowns and restrictions, has brought vast change to the routines of families across the world. This work has had a small part in deciphering what these changes could mean for those across Yorkshire and the Humber. Dashboards with mapping have shown to be an important tool for understanding how health impacts of COVID-19 are distributed, this same logic applies to how lockdown restrictions combine spatially.
COVID-19 causes health, social and economic impacts
Creation of a dashboard that displays different flavours of lockdowns
Supports pre-existing conclusions regarding the impact of COVID-19 lockdowns
Interrogation of complex layers of information aids policy reform
Current data are insufficient to capture COVID-19 lockdown impacts
Research themes
Urban Analytics
COVID-19
Spatial Inequality
Interactive Visualisation
People
Rosalind Martin, Data Scientist Intern at LIDA/CDRC
Professor Rachel Franklin, Professor of Geographical Analysis at the University of Newcastle
Professor Susan Grant-Muller, Chair in Technologies and Informatics at the University of Leeds
Professor Alison Heppenstall, Professor in Geocomputation at the University of Leeds
Dr Vikki Houlden, Lecturer in Urban Data Science at the University of Leeds
Partners
Consumer Data Research Centre (CDRC)
Funders
This project was funded by the Consumer Data Research Centre.
Funding for SPENSER is provided by The Alan Turing Institute, project reference R-LEE-004.
References
Smith, D., Moon, G. and Roderick, P. 2020. Indices of Economic Insecurity: Version 2, August 2020. GeoData Institute, University of Southampton. [Online]. [Accessed 18th March 2020. Available from: https://www.mylocalmap.org.uk/iaahealth/
The two-week-long Turing-LIDA Data Study Group (DSG) took place last month, with an incredible amount of data analysis and investigation undertaken in response to challenges set by six organisations (Challenge Owners).
The reports detailing each team’s findings will be published in September. In the meantime, let’s take a look inside the DSG from three different perspectives.
Challenge Owners
One of the six Challenge Owners was Asda. Tom Dart, Senior Supply Chain Manager, explained that, “Both my colleague, Matt [Burt], and I attended the University of Leeds and had a really positive experience. Matt has recently graduated so retained some links and was able to start the collaboration. Our view is that we can use the latest academic techniques to help improve and educate the data science programs that we are establishing.”
With DSGs only having taken place remotely since the beginning of the pandemic, access to data is a big challenge, although it is all managed securely through cloud-based safe data havens. “The initial data transfer agreement took some time to set up and we had some teething issues sending the data. However, we enjoyed close contact with the DSG team throughout and there were always people on hand to assist with questions. I really enjoyed the interaction with the students and hearing their fresh ideas.”
“We will definitely look to engage again with the DSG and have wider collaboration in general on data science topics.”
Network Rail were another Challenge Owner. Stephen Brooks, Senior Engineer, said: “I saw the invitation to be involved in the DSG though communications from the Chartered Institute of Civil Engineering Surveyors. Having consulted with colleagues we agreed that it was a great opportunity to offer what we thought was an ideal challenge. We have already looked at our aerial survey data in multiple different ways to see how we can exploit value from existing data holdings, yet we felt that the DSG offered a potentially different approach to extract greater insight.”
“By far the best reason to be involved was to access the innovative minds of students who may look at the challenge in a different way to some of our existing processes. We were not disappointed. The presentation from the DSG team, just ten days after starting the work, was professional, informative, and delivered very well by all participants.
“Based on this experience, I will certainly be encouraging colleagues to engage more with academic institutions to see the art of the possible from a different perspective. We will also continue to look at new ways to gain even more value from our existing data.”
Principal Investigators/Facilitators
Dr Patricia Ternes is a Research Fellow at the University of Leeds and was the Principal Investigator for one of the Challenges. “There were two reasons I decided to participate,” she said. “Firstly, the opportunity to collaborate with The Alan Turing Institute and to engage with the industry and, secondly, to gain experience as a Principal Investigator.”
“Having contact with real and current challenges was the best thing about being involved in the DSG, as well as monitoring the use of different methods to address these challenges. The biggest challenge was time. Our project had several possible avenues, but in order to reach the final objective, we needed to continuously narrow down the range of work. Choosing when to do this, and which path was a priority, was quite challenging.”
“I believe this challenge is the beginning of a transition from early- to mid-researcher career. I still have a long way to go, but the DSG certainly showed me some fundamentals for this achievement to be possible.”
While the remote nature of the DSG created new challenges, it also provided the huge benefit of enabling participants to be involved no matter where in the world they were or what their personal commitments. “As the DSG was remote, I could (just about!) manage home life with this event, even when my family and I suddenly had to self-isolate,” said Dr Rachel Forshaw, Assistant Professor of Economics at Heriot-Watt University.
“The best thing about being involved was all of the smart and interesting people I met. We had very different backgrounds, and so looked at problems from completely different angles – which is fantastic for coming up with new ideas.”
As with so many participants, the DSG has hopefully provided a springboard into future career development. “The focus of my PhD was not data science, but it’s where I hope my research is moving towards. Testing my self-taught skills in an event like this really helped me to see the areas I’m good in and those that I can improve. It’s solidified in my mind that I would like to pursue using data science techniques in my research. I also feel (after a year of no childcare due to COVID-19, and very little research output as a result) that my confidence level in my own abilities has increased.”
Joel Dyer, Mathematics PhD Student at the University of Oxford, was a Facilitator with another of the DSG teams. “My role was ‘part-servant-part-leader’ for the team of participants. That involved guiding group discussions, overseeing the team’s research, and working to ensure each member drew benefit from – and, importantly, enjoyed – the DSG. The best thing about being involved was to see the culmination of everyone’s hard work in the final presentation, and the extent to which the team collectively and successfully pulled together the different contributions into a coherent story.”
“The interface between academia and industry is somewhere that I think many interesting research questions can arise. The DSG enabled me to gain further experience of that interface.”
“My experiences of the DSG will have a significant long-term impact on my career: the collaboration skills I have learned and developed will remain relevant for the rest of my career whatever path I take, and my experiences as Facilitator will help to inform my decision-making in any future leadership position I hold. Furthermore, the DSG has been an excellent opportunity to expand my professional network, and I am excited by the new opportunities this may bring about.”
Participants
Ciaran Devlin, Postgraduate Researcher at the University of Warwick, voiced the shared experience that the combination of time limitations and “data was the biggest challenge! We had an enormous data set, including different types. This was both exciting and daunting, but it was the main reason I wanted to work on my particular project. We had two weeks to produce something useful so in some instances we needed more computational power to run models. LIDA provided access to Jade2 which helped greatly, but also added another element of complexity.”
“Taking part in the DSG was really beneficial. My team were a diverse, engaged and incredibly intelligent group of people and I learned a lot from everyone, gaining insight into different approaches to data science. Everyone contributed interesting and thought-provoking ideas and methods, some of which I will definitely take forward into my own research.”
“I would recommend the DSG to anyone interested in applications of data science and machine learning. I not only gained a lot from my own project, but also from listening to the other teams and their methods when working on different problems. This was a great event and I hope to return in future.”
And last, but by no means least, one of our very own LIDA/CDRC Data Science Interns, Rosalind Martin, was also involved! “The DSG was advertised with six interesting challenges, half of which were related to the retail sector. My current Internship project is based in the world of nutrition and government legislation, so I wanted to do the DSG in order to look at retailer issues from a slightly different perspective.”
“The biggest challenge was definitely time management! There was so much that the team wanted to do and only two weeks to do it in. Our team split off into a few different groups so we could collectively try multiple methods. We regularly came together to hear about one another’s outputs and ask questions of the methods.”
“The DSG was a fantastic opportunity to develop those time management skills, alongside maturing my team-working skills through the use of regular messaging, stand-up meetings and Kanban boards. I know that I’ve been equipped to get stuck in quickly and meet the desired outcomes when I next have a busy week at work or I start working with a new team for a project.”
Turing-LIDA Data Study Group – intensive and innovative collaboration addressing real-world problems
Monday 12th July saw the launch of an exciting two-week online Data Study Group, being held in partnership between LIDA and The Alan Turing Institute.
Data Study Groups (DSG) are an incredible opportunity for organisations (Challenge Owners) to work with talented multi-disciplinary researchers on real-world data science challenges. Those challenges can be quickly and intensely brainstormed and interrogated during the DSG, with solutions proposed in a final report along with ideas and suggestions for potential further investigation.
“As an organisation we want to embrace the power of Data Science and be on the front foot for the latest thinking. Linking up with the Turing-LIDA DSG will help us turbocharge our projects with the latest academic techniques.” (Challenge Owner)
“We got involved in the DSG to get access to highly qualified critical thinking and a solution to our business problem.”(Challenge Owner)
Your mission, should you choose to accept it
During an additional pre-cursor week, the six Challenge Owners – Asda, Network Rail, Ordnance Survey NI, Sainsbury’s, Vet A-I and another retailer – outlined their challenges in presentations to 62 participants (including researchers from LIDA and the CDRC). With those challenges ranging from the effect of the weather on sales, to the need to accurately locate and identify urban features such as drains, participants then indicated their preferences before being allocated to teams.
Following several “getting to know you” opportunities as well as training sessions on “Collaborative Report Writing” and “Teamwork on Agile projects”, those teams were ready to hit the ground (or data!) running on Monday 12th for an intensive fortnight of research and investigation.
WFH(WD) – Working from home (with data)
Working remotely has its challenges, as well as its benefits. While there isn’t the energy and intensity of being in the same room, bouncing around ideas and issues in real-time, teams have daily “stand-ups” (part of working in an Agile approach to solution development) and a dedicated Slack channel for communication.
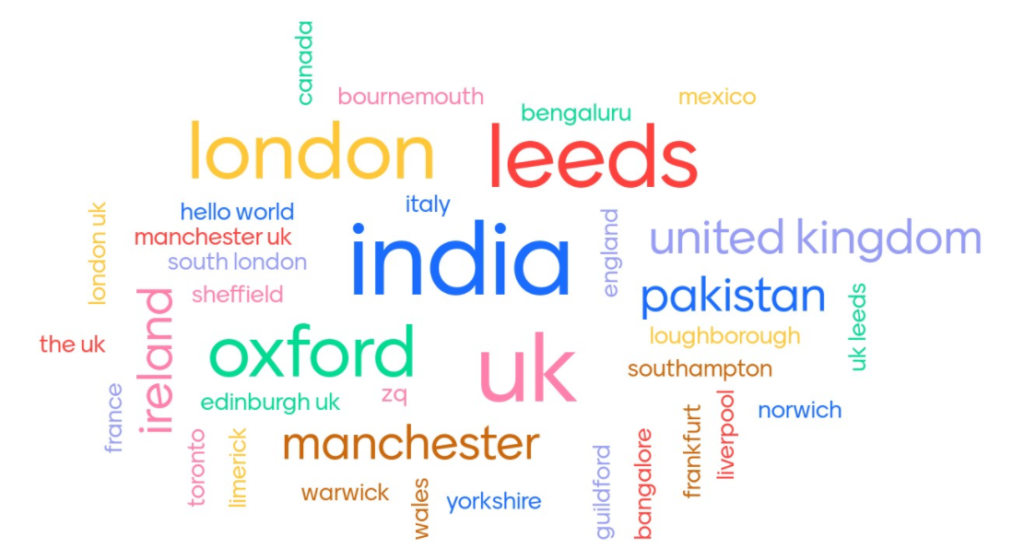
One fantastic benefit is that remote working has enabled researchers to participate from all over the world, including India, Pakistan, Canada and Mexico.
It also provides the additional learning opportunity of working globally across different time zones!
The pandemic and WFH has necessitated significant changes in working securely with data. Usually DSG teams would access that within safe rooms in a location like LIDA or the Alan Turing Institute, but the last 18 months have seen great advances in cloud-based data safe havens. Four projects will be hosted in Turing Safe Havens, while the data for the other two will be analysed within LIDA’s new LASER platform.
Each team will produce a report for their Challenge Owner at the end of the DSG – we’ll share more information about their research insights and discoveries once those are approved and published.
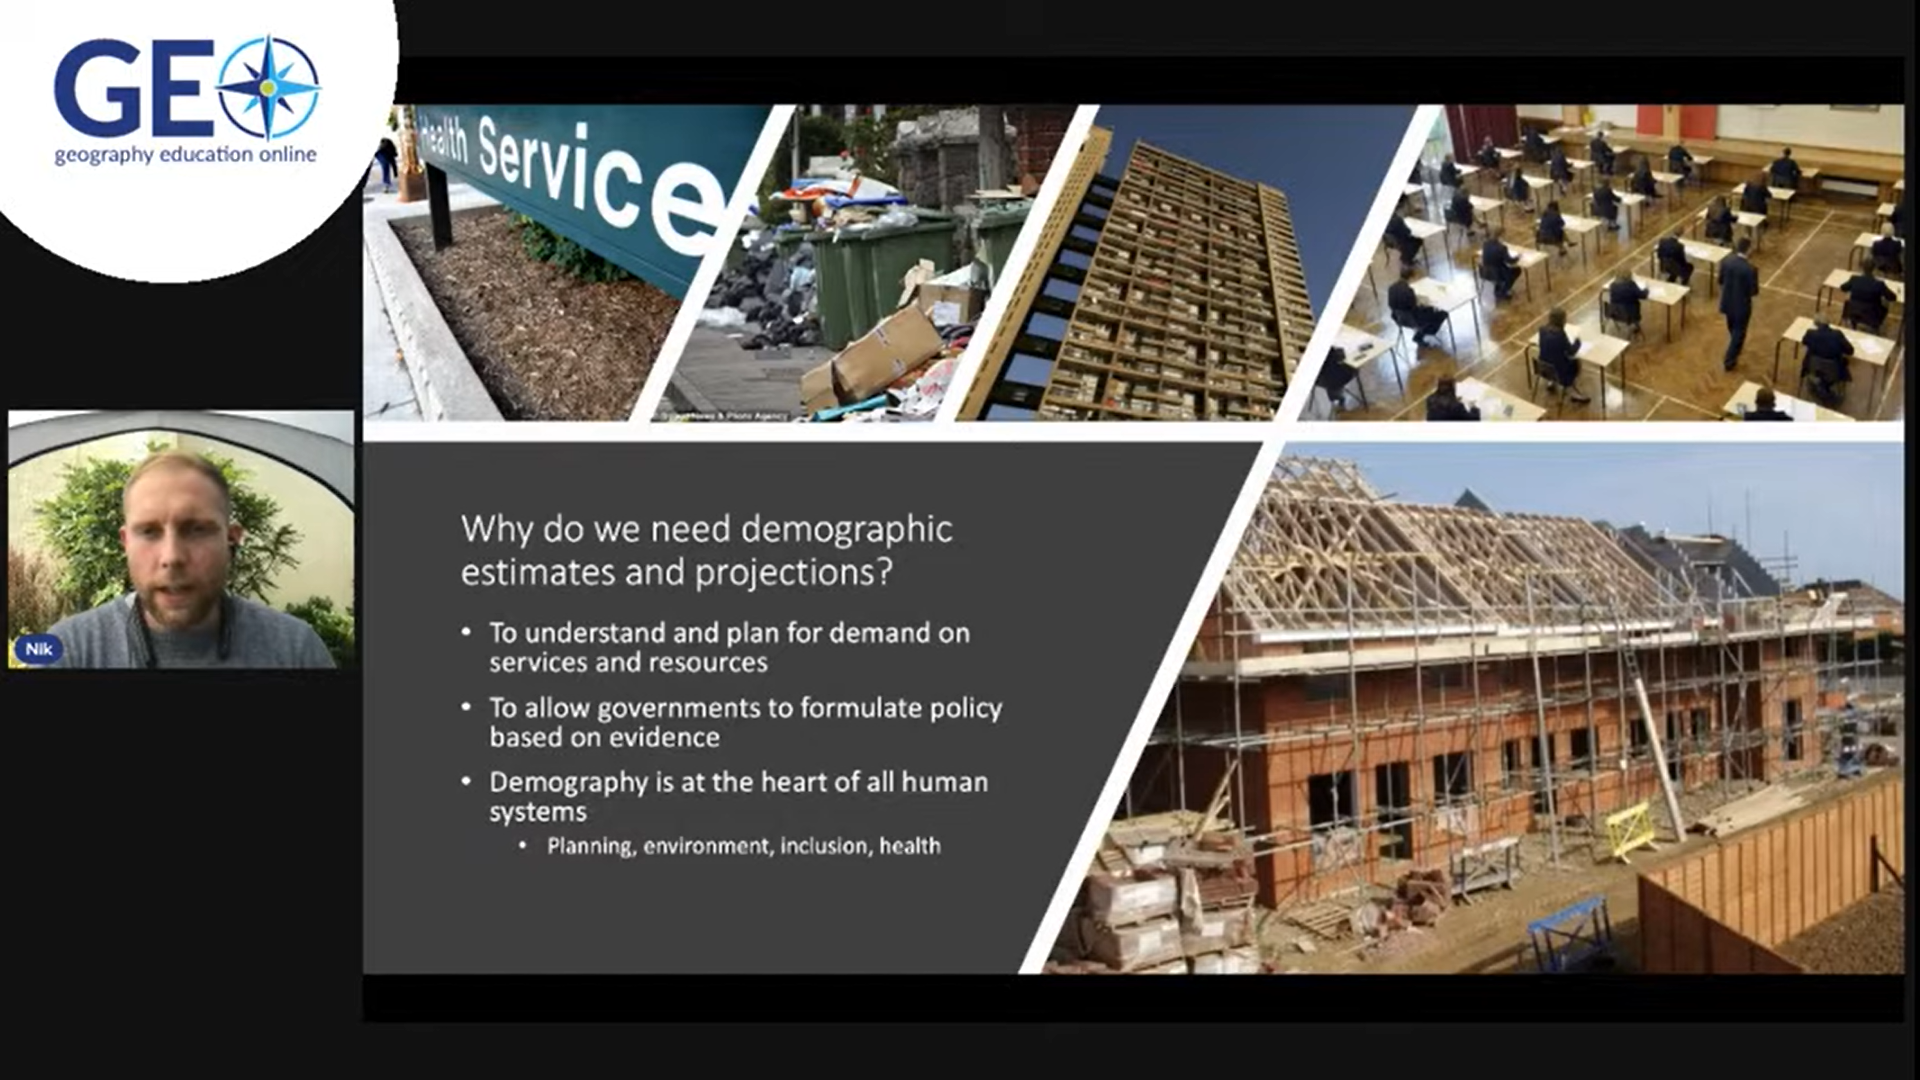
On Wednesday 30th June, CDRC Co-Director, Dr Nik Lomax, delivered an online talk entitled “Demographic Change and Population Projections” to secondary-school students.
“Geography Education Online approached me because population is on the school syllabus and I’ve done lots of work on population estimates and projections1, 2. It was an enjoyable experience and an interesting challenge to translate my expertise and research for a new audience.”
Nik began by talking about why it’s important we have accurate population estimates and projections for planning and policy. “Governments need good evidence in order to make good policy,” he told the students.
Sharing maps and data visualisations from the United Nations, Office for National Statistics and the CDRC, Nik demonstrated a series of trends and outcomes across different areas and population sub-groups.
He discussed global population growth and its implications (comparing areas with very different demographic profiles: sub-Saharan Africa and Spain), highlighting how potential support ratios (the number of working age people to those who are retired) would decline over time as populations became older. He then turned his attention to the types of projection models which are routinely used and the demographic inputs to those models, and how varying these inputs could produce very different variant projection scenarios.
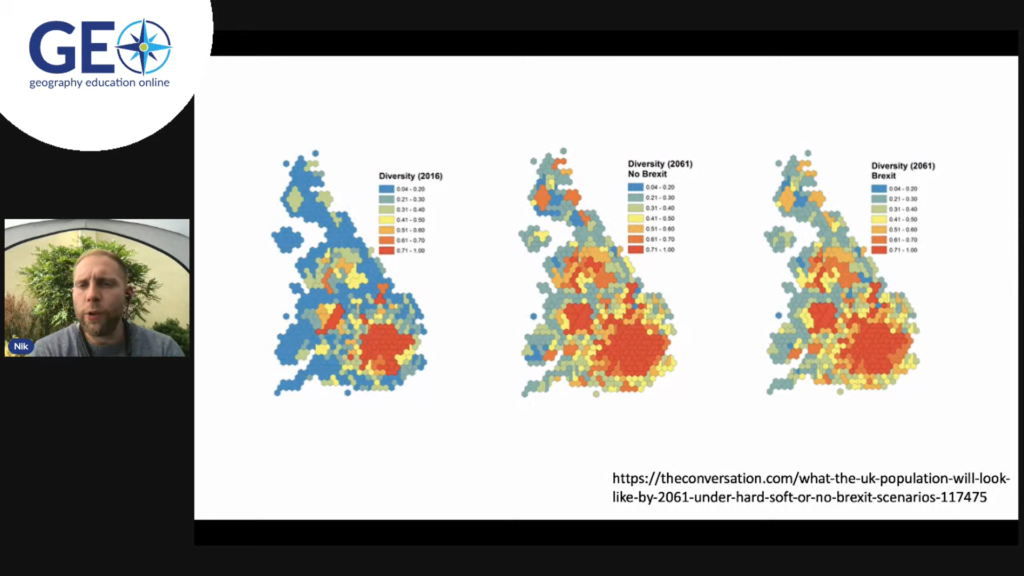
Nik talked about the importance of breaking down these demographic inputs by geography and other population attributes, because there’s so much variation between different areas and groups. He used a series of migration schedules and age-specific fertility & mortality rate graphs to demonstrate this variation. He then discussed an example from his own research which demonstrated how ethnic group populations might change under different migration scenarios based around potential policy post-Brexit, showing how diversity would increase in the UK under every scenario.
“I wanted to link to the school syllabus but also provide an example grounded in my research that people wouldn’t have seen before, in this case the migration scenarios for ethnic groups work from this paper.”
“I hope the audience took away the message that these models are very useful but don’t represent the ‘truth’ because the future is uncertain. Projection models are reliant on good data inputs and are sensitive to the assumptions that are made about future trends.” Nik finished by encouraging the audience to have the confidence to look at the data and interrogate the outputs of models, and directed them towards maps.cdrc.ac.uk as a useful resource!
Being A Data Science Intern – insights, challenges and benefits
Rosalind is one of the Leeds Institute for Data Analytics’s (LIDA) current Data Scientist Interns, with a background in Geography (BSc) and Geographical Information Systems (GIS MSc).
I’ve always been a fan of physical geography, but as module choices expanded throughout my degrees I was increasingly drawn to (spatial) data modules. I love using GIS and coding to solve big data challenges.
My internship has been made up of two six-month projects, both funded by the Consumer Data Research Centre (CDRC). My first project was titled ‘Isolation and Exclusion in a Social Distancing Covid World’. Here, I worked under the supervision of academics from the Universities of Newcastle and Leeds, aiming to identify people and households at risk of isolation and exclusion as a result of Covid lockdown rules.
My second project is in the world of nutrition where I’m working closely with Leeds academics, Dr Michelle Morris and Vicki Jenneson, and a retail partner. I am designing an open access tool which will assist retailers in implementing new policy restricting the promotion of foods that are high in fat, salt and sugar – a crucial part of reducing obesity in the UK.
What has been my experience of the LIDA Internship Programme?
As I’m sure many people would echo, the Covid pandemic has placed our jobs in unfamiliar situations. The reality of this internship being my first full-time post means that I’ve not been comparing my days to ways I have worked in the past. Instead, my experience has been shaped by remote team working with virtual training, coffee breaks and meetings. Although working from home (WFH) comes with its own challenges and complexities, I believe this has given me the capacity to be thankful to work on engaging projects rather than pining for something I used to have!
Due to the pandemic, many interns have been able to experience otherwise inaccessible conferences and workshops as they’ve transitioned online. I’ve been to events held by The Alan Turing Institute, the Royal Society, CDRC and more! Working as a remote cohort, the interns have set up coffee breaks and a weekly “pub” session to replicate those water-cooler conversations, lost due to WFH. This space allows us to talk about our projects, seek help from others who have different skillsets and to simply get to know each other.
What have I been proud to have accomplished so far on the internship?
Coding while WFH has been a true test of my perseverance. In the absence of spinning my chair around to ask for a fresh pair of eyes, I’ve really had to learn how to use documentation and online forums to navigate my coding challenges. I’ve also learnt how best to send questions (with reproducible examples) to other interns or my supervisors. I’ve seen a visible increase in my confidence and ability between my first and second projects, and I know this skill will continue to serve me in future careers.
What are my quick hacks for getting the most out of the internship?
Obtaining data always takes longer than you think: be proactive in learning methods, using dummy data and reading around the subject while you wait
Talk to the interns: each intern has a different background and therefore their own unique combination of skills. Ask questions and be ready to offer your own experiences if asked
Write detailed descriptions of your GitHub commits: your future self will thank you when you return from Annual Leave to find you have a detailed record of what you were working on before you left for your holiday
How has working with the Consumer Data Research Centre (CDRC) helped with the delivery of my first project?
My first intern project aimed to identify those at risk of isolation and exclusion under Covid lockdown rules. In order to make detailed predictions of impacted individuals and households, I worked with a micro-simulated synthetic population called SPENSER. This CDRC and Alan Turing Institute funded project was essential for me to make predications at the household level. I also used other datasets to support my work including CDRC’s Access to Healthy Assets and Hazards dataset. The availability of these datasets enabled me to explore the Covid restrictions that were thought to negatively impact an individual’s risk of isolation.
How will this Internship help me progress my career in data science?
I have learnt more of the mechanics of data access throughout both of my projects – ranging from obtaining freely-available through to applying for safeguarded datasets (including how long the process can sometimes take!). In my projects, I have had the opportunity to talk to the City Council, UK and international universities, not-for-profit organisations and retailers. Speaking to people in a wide range of data roles has helped me to better understand the opportunities available in data science, and how roles interact with non-data scientists.
Why would I recommend the LIDA Data Science Internship?
The LIDA Data Science Internship has given me the opportunity to own the delivery of two data science projects situated in very different subject areas. This has really expanded my understanding of how data can be used to solve very complex but nationally topical challenges. Owning the delivery of the projects as someone straight out of their Master’s has been a challenge, but I have been well supported by experienced supervisors and the extended LIDA network. With the breadth of internship projects and collaborators available across and in partnership with LIDA, the internship is the place to be!
LIDA is currently recruiting for its next cohort of Data Scientist Interns, due to start at the end of September 2021, with several projects taking place within the CDRC. Click here for more information and to apply.