

The advantages of being physically active have never been more apparent, with proven benefits across a wide range of health conditions. Traditionally, we might consider the beneficial role of physical activity to be in reducing obesity incidence and preventing non-communicable diseases, such as cardiovascular disease and type 2 diabetes. However, the COVID-19 pandemic has thrown further positives into the spotlight, as being physically active has been shown to reduce the risk of severe COVID-19 outcomes. Moreover, lockdowns and state-sanctioned time for exercise highlighted the importance of physical activity to mental health and wellbeing.
Physical inactivity is responsible for 1 in 6 deaths in the UK (equivalent to the risk from smoking1), with 1 in 3 men and 1 in 2 women not meeting the recommended 150 minutes of moderate to vigorous activity a week1. To reduce physical inactivity, we need to identify and remove the barriers to being active. These barriers are diverse and wide ranging, varying from person to person. Examples include, but are not limited to: increasingly sedentary occupations, time or monetary constraints and environments that do not support activity.
To best identify what and where these barriers to being active are, we need to establish a good understanding of where, when and how people are active. However, studies investigating physical activity behaviour are typically limited by sample sizes, small study areas and shorter study durations.
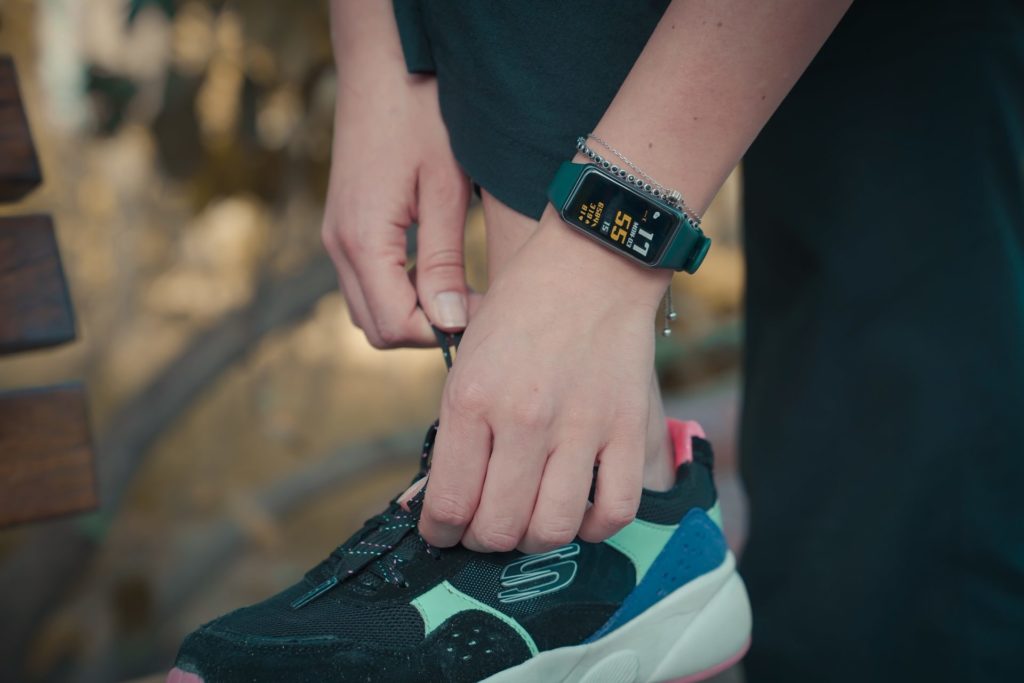
Increasingly, individuals are monitoring their own activity and fitness levels using smartphone apps or wearable trackers such as Fitbit, Garmin or smartwatches. Secondary use of these consumer data can provide researchers with new insights into physical activity behaviour. In this research, we use secondary app data provided by FUELL Ltd‘s Bounts app (available for use by researchers via application to the CDRC). We evaluate how useful secondary smartphone data are in providing insight into how active the public are. To do this, we first need to assess how representative app users are of the population as a whole. Finally we uncover key activity behaviours associated with different age and gender user profiles.
The app – who is using it?
The Bounts app was commercially available on all major app provider stores, with users earning points for activities which could later be exchanged for vouchers and prizes. All user data is pseudonymised and no identifiable user information is shared with the researchers. Additionally, data is only accessible to those with data security training and in a data secure environment.
We used the data of 30,804 app users who recorded seven or more days of activity in 2016. With an average user age of 39, women make up a significantly larger proportion of app users (77.7% of users). 43.8% of users provided a postcode district which we linked to the Office for National Statistics socioeconomic classification. Unlike traditional studies, which tend to underrepresent lower socio-economic groups, we found there was no substantial socioeconomic difference in the areas where Bounts users lived compared to the general population.
Research highlights
Seasonal and weekly trends in physical activity behaviour
Users recorded on average 218 days of activity, which is substantially longer than the typical seven-day data collection period in traditional physical activity studies. Thanks to this long monitoring period, we were able to observe distinct patterns in activity behaviour across weekly and seasonal timeframes.
Across the year, we can see the role daylight saving plays, with a higher number of activities recorded by users over the summer months when evenings are longer, dropping off in autumn as the days get shorter (Figure 1).
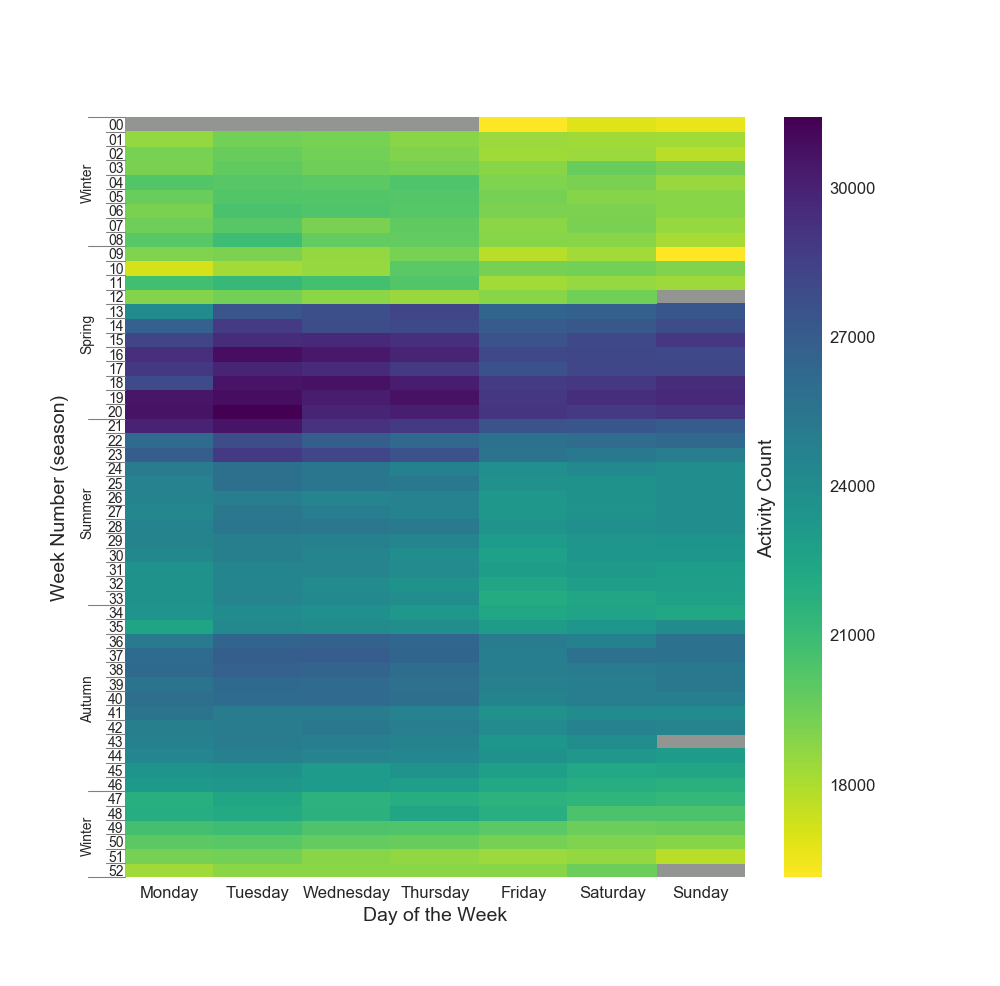
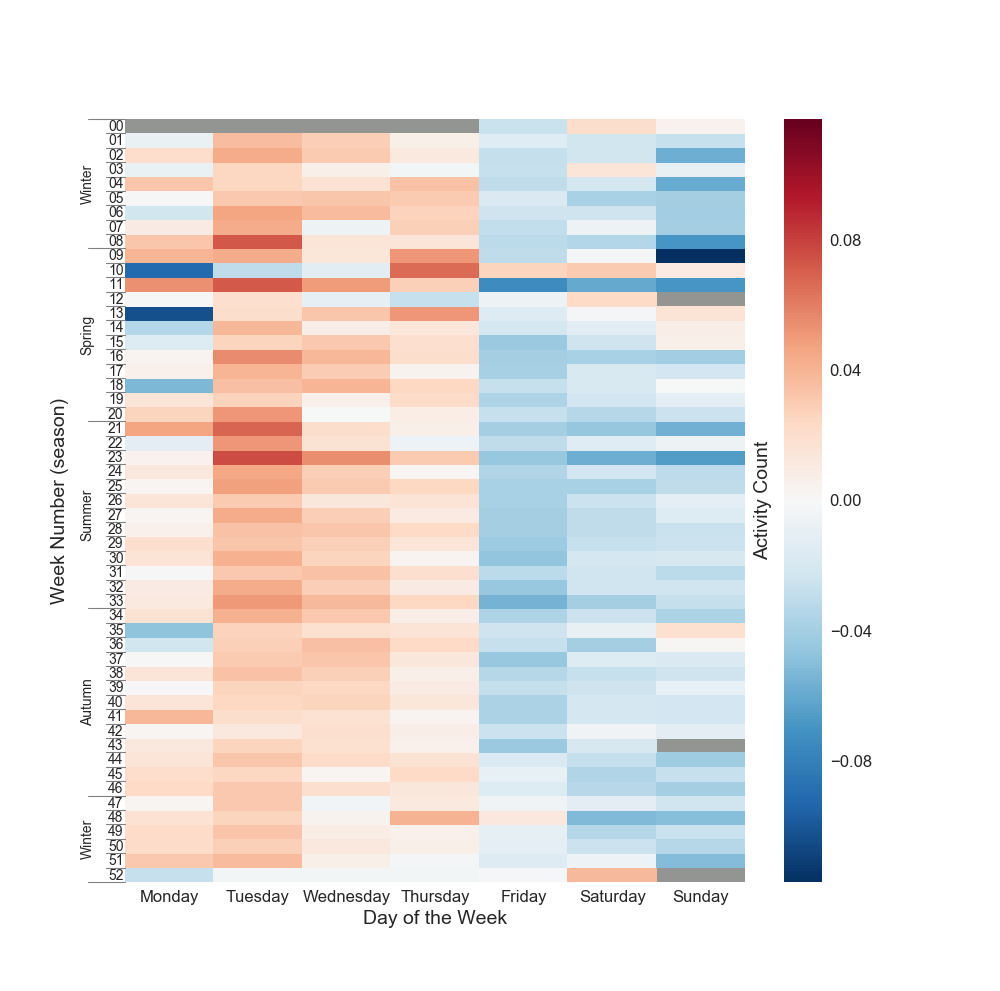
We can also see a weekly pattern in activity behaviour with the highest number of activities recorded mid-week, peaking on Tuesdays (Figure 2). Higher weekday activity levels are suspected to be functional activity around commuting behaviours. This goes against the ‘weekend warrior’ theory that individuals tend to exercise more on the weekends and less on weekdays.
A higher level of functional activity is associated with women and those in less affluent socioeconomic groups. This corresponds to our user sample which has a high proportion of women and captures users from less affluent socioeconomic groups, who are usually underrepresented in physical activity studies.
Who is meeting the physical activity guidelines?
For each week that a user recorded activity, we calculated whether the culmination of this activity was enough to meet physical activity guidelines of 150 minutes of moderate to vigorous activity per week. This includes any activity with greater or equal intensity to brisk walking.
Despite the known health benefits, the overall proportion of weeks meeting these physical activity guidelines was low. The youngest and oldest users were the least likely to meet the guidelines, with those aged 35 to 44 most likely to meet the sufficiently active threshold.
Men were almost twice as likely to meet the guidelines, with 24.2% of weeks recorded by male users classed as adequately active compared to 12.4% of weeks recorded by female users. Additionally, living in the most affluent area compared to the least affluent (in terms of employment), improved the odds of recording an active week by almost 5%.
How useful are secondary smartphone data?
Secondary smartphone data are an invaluable tool to provide new insights into physical activity and other health behaviours, as they give a breadth and depth of detailed data not available from other methods.
On the flip side, using these data requires careful consideration, including meticulous implementation of data anonymity and ethics, attention to data handling and cleaning processes, and skilled training to be able to handle such a large detailed dataset. Used in tandem with more traditional primary data collection studies, secondary smartphone app data have the capability to address some of the most complex questions around physical activity behaviour. We are still very much in the infancy of using these data and have just scratched the surface of their full potential.
Read the full paper: Pontin F, Lomax N, Clarke G, et al. Socio-demographic determinants of physical activity and app usage from smartphone data. Social Science & Medicine 2021: 114235.
References
1. Public Health England. Physical activity: applying All Our Health. 2019.