
The COVID-19 pandemic led to lockdowns being implemented all over the world, including in the UK. The aims of the project were to investigate relevant data sources for modelling the ambient population of Leeds City Centre during COVID-19 and analysing the impacts that lockdown policies had on urban footfall. The research builds on previous work undertaken with Leeds City Council by intersecting key dates from the English lockdowns and integrating these into machine learning models to assess the importance of different aspects of lockdowns. It also predicts what “business as usual” may have been like had there been no pandemic.
Analysis notebooks and scripts can be accessed at https://github.com/tbalbone31
Data and methods
Leeds City Council have been collecting footfall data for more than a decade. The data were wrangled and aggregated to create a history going back to 2008. These data were then analysed alongside key lockdown dates to determine where trends in urban footfall intersected, raising questions about what aspects of these policies might have had the most impact. The data cover a relatively small geographical area of Leeds City Centre and only reflect pedestrian traffic going past the locations identified by the cameras. There are issues with data quality, such as potential double counting, periods of time with missing data and inconsistent file formatting, however it covers a large temporal scale and many problems can be worked around.
Google COVID-19 Community Mobility data was analysed as a potential alternative data source to the Council data. It shows changes in mobility from a baseline for six different destinations (see the website for more details). The smallest relevant spatial coverage is the Leeds City Region. This was considered too large to isolate any changes impacting the city centre, making comparison of trends difficult.
The Council footfall data were resampled to show daily counts on which analysis was then conducted. Visual analysis was undertaken to identify footfall trends over the course of the pandemic against key dates pertaining to the implementation and lifting of certain COVID-19 restrictions. These key dates were decided from research into when major legislation came into force or government announcements about restrictions were made. The questions generated from initial analysis were then explored by creating a series of machine learning models using Random Forest Regression in the Python SciKit Learn package.
The first model included a series of input variables to represent different aspects of society that had restrictions placed on them alongside other external conditions (such as weather, school/bank holidays, day of week, etc). Variable importance was used to identify what (if any) aspects of lockdown might be significant in predicting future changes in footfall. The second model omitted any lockdown related inputs and was designed to make predictions on what “business as usual” might have been like had the pandemic not happened.
Due to the inherently ordered nature of time series data, both models were validated using a method known as “Walk-Forward Validation” instead of the default Cross-validation included in SciKit Learn and often used on Random Forest Ensembles. The implementation of Walk-Forward validation allows the model to be retrained after every prediction on the validation dataset, essentially “walking forward” through the time series. This avoids potential data leakage because of the randomised nature of Cross-validation.
Key findings
The chart below shows the resampled footfall data intersecting with key dates from COVID-19 restrictions.
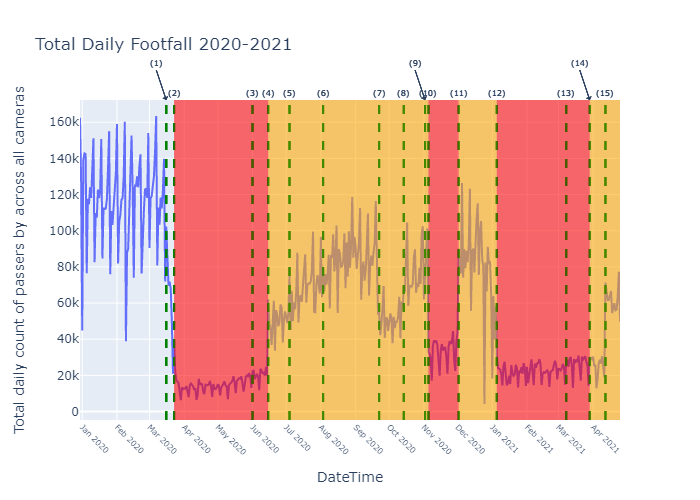
Key dates are shown as a dotted line with a number relating to a key. Red zones indicate “official” lockdowns whilst orange represents periods where a variety of restrictions were in place but in the process of being lifted/introduced individually. A summary of how this impacted footfall is below:
- Footfall started to drop immediately after the announcement on 16th March 2020, no official restrictions implemented.
- After non-essential shops and schools reopened on 15th June 2020, footfall started to rise again.
- Footfall continues to rise through summer until around 22nd September 2020 when some restrictions were announced.
- Footfall rises whilst Leeds is in tier 2 and 3, potentially because gatherings are only permitted in public spaces.
- The second and third lockdowns drive footfall back down again until restrictions begin to ease again in April 2021.
The first machine learning model was intended to explore whether any lockdown variables would be significant in predicting future changes in footfall. Variable importance (top 10) is shown below.
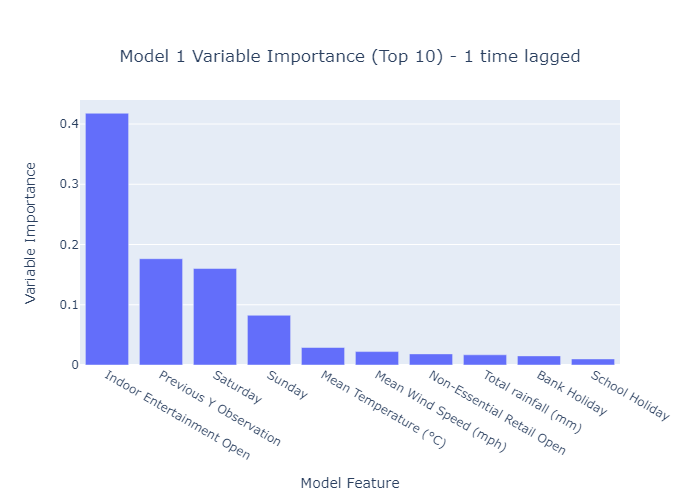
The most important lockdown-related features were indoor entertainment and non-essential retail. Whilst this is only an initial model and not a definitive conclusion, it does help indicate what aspects of lockdown might have impacted pedestrian traffic in the city centre more than others.
The second model was designed to test how useful the data would be in predicting what “business as usual” may have been like.
There was little difference between error scores across different numbers of trees, so a compromise of the best score and least processing power (500 trees) was chosen. The model predictions using this hyperparameter are shown below.
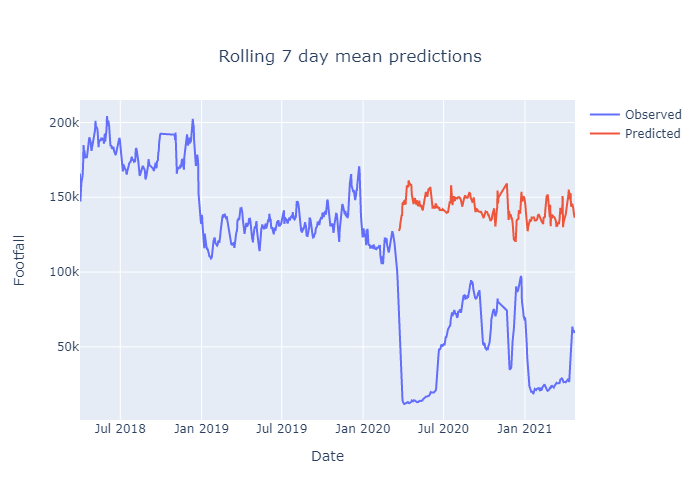
Results from this initial model are by no means definitive, however the potential to quantify how much footfall has been lost exists. For example:
- Average daily footfall in the lead up to Christmas (taken as 30th November to 24th December 2020) was approximately 36% lower than predicted.
- Average daily footfall over the school holidays was approximately 63% lower than predicted.
- Approximate footfall loss for individual Bank Holidays was also calculated. Most recorded over 90% lower than predicted values except for the August Bank Holiday which was around 22% lower.
Value of the research
Initial analysis has already been delivered to Leeds City Council. An aggregated dataset of footfall camera data has been created and is available on the Consumer Data Research Centre (CDRC) Data Store for future research. The initial models developed can be used and refined by future researchers and develop more accurate predictions, whilst more specific time series packages can be explored.
Insights
- Urban footfall and ambient population was significantly impacted by COVID-19 lockdown policies (as was intended).
- Closure of Indoor Entertainment and Non-Essential retail appear to be the most important lockdown-related factors in predicting footfall change.
- Consideration must be given to how time series data is processed in classic machine learning models such as Random Forests.
Research theme
Urban analytics
People
Tom Albone – Data Scientist Intern (LIDA)
Dr Nick Malleson – Professor of Spatial Science
Professor Alison Heppenstall – Professor in Geocomputation
Dr Vikki Houlden – Lecturer in Urban Data Science
Dr Patricia Ternes – Research Fellow
Partners
Leeds City Council