Home » Urban Analytics

Analysing COVID-19 Mobility Responses (Case Study)

Analysing COVID-19 Mobility Responses through
Passively Collected App Data (Case Study)

Using smartphone GPS mobility data to understand population-scale responses to COVID-19 ‘lockdown’ policies in England.

Project overview

COVID-19 has prompted the enhanced use of novel mobility data in public life, offering fascinating insights into population-wide behavioural responses to Non-Pharmaceutical Interventions (NPIs) such as ‘lockdown’ stay-at-home orders. Here, we use privacy-preserving smartphone data to understand these trends at a regional scale over a longitudinal period spanning January 2020 to May 2021 for England, with a specific focus on examining adherence to policy measures on household visitation.

The concepts of adherence and fatigue to ‘lockdowns’ are highly debated ideas with limited observational evidence, despite their key role in supporting current policy assumptions. The SAGE report of 16th March 2020 underscored this when it said there was “(limited) evidence on whether the public will comply with the interventions in sufficient numbers and over time” (p.2) with respect to COVID-19 measures. Our study uses a novel measure of ‘house visits’ activity to cut out general noise and is explicitly purposed with better informing health policy interventions in the context of a public health emergency.

Data and methods

According to UK Government polling for the Centre for Data Ethics and Innovation (CDEI), 58% of over 2000 UK adults surveyed in Sept 2020 were either ‘quite comfortable’ or ‘very comfortable’ with “researchers using data to improve knowledge to help keep the public safe” during COVID-19, with just 14% being ‘quite’ or ‘very uncomfortable’. This finding was positive overall across all UK regions, all age groups, all income levels, all education levels, and whether or not people were worried about COVID-19 itself. There were also 16.5 million voluntary downloads of the NHS COVID App for modern smartphones in England and Wales in 2021. Clearly, there is a public demand for the harnessing of data to help tackle COVID-19.

Our study used anonymous, privacy-enhanced GPS smartphone mobility data from users who opted-in to data collection for research purposes under a GDPR compliant framework. Data was supplied by American and Italian location intelligence company Cuebiq, under their Data for Good program. We use unsupervised machine learning methods (DBSCAN) to make home and work area assignments, which are then taken out of user activities. Through a validated ‘process of elimination’ using POI analysis, we can then generate an aggregate measure of the proportion of de-identified users taking a house visit, for a given county area, on a given day. The output data is thus aggregated to strict privacy requirements set by Cuebiq for both temporal and spatial scales before it is analysed, yet still able to harness the precision inherent in such emerging data streams, in order to optimally inform public health policy under COVID-19. Limitations of the methods and data, including a potential lack of representativeness, were extensively discussed in the published findings. Importantly, the data could not accurately distinguish between visits to inside homes compared to outside garden areas.

Key findings

This LIDA project led to the publication of an original research paper ‘Household visitation during the COVID-19 pandemic’ in the Nature journal Scientific Reports in November 2021, detailing both methods and results.

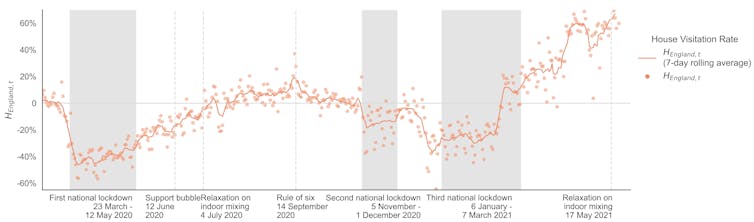
Our results track the evolution of a measure of household visitation levels in English LTLAs (Lower-Tier Local Authorities) over time – notated as ‘HEngland,t’ throughout the study. This index value was a national level, calculated through the mean average of weekly levels for each of England’s 315 LTLA areas, excluding the Isles of Scilly due to sample size issues. This weekly measure of levels of household visitation was measured against a pre-pandemic baseline figure taken from across 13th January 2020 to 2nd March 2020. The baseline was specific to both each LTLA area, as well as to each day of the week, to account for relative changes in each locality.

Figure 1: Time-series showing levels of household visitation across Jan 2020-May 2021 (mean average Lower-Tier Local Authorities rate in England against area- and day-specific 2020 baseline), alongside new COVID-19 cases.  Source: https://www.nature.com/articles/s41598-021-02092-7/figures/1

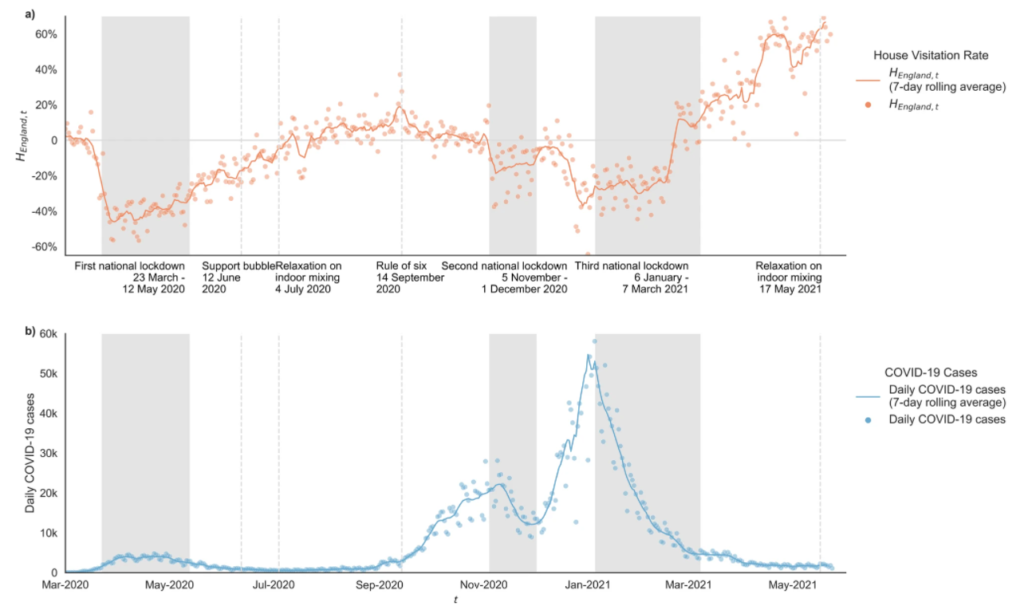
Figure 1 from the paper here shows the evolution in ‘HEngland,t’ across the full study period, as well as the evolution of recorded COVID-19 cases. As can be seen, levels of household visitation dropped dramatically in late March 2020, dropping to an all-pandemic period low of –56.4% relative to pre-pandemic baseline levels on 29th March 2020. In Figure 1 we have marked ‘national lockdown’ periods as those when stay-at-home orders were in place, during which time household visitation was prohibited in almost all cases. By taking mean averages across these time periods, we can witness household visitation levels averaging −39.33% during the 1st National Lockdown (23/03/20 – 12/05/20) below baseline levels, compared to higher rates of average house visits activity recorded during the 2nd National Lockdown (05/11/20 – 01/12/20), when rates were only averaging −15.28% below pre-pandemic levels by comparison. We didn’t witness a great jump in household visitation in the immediate aftermath of the introduction of ‘support bubble’ exemptions in mid-June 2020.

Heading into the 3rd National Lockdown (06/01/21 – 07/03/21), mobility activity reduces pointedly ahead of the imposition of national restrictions, reflecting perhaps the impact of COVID-19 risk perception and/or the new Tiered restrictions announced on 19th December 2020 in response to the detection of the new Alpha variant in South-East England. These trends were reinforced by the imposition of the 3rd National Lockdown on 6th January 2021, which kept levels of household visitation at levels between the 1st and 2nd National Lockdowns at -26.22% below (06/01/21-14/02/21) baseline rates until approximately mid-February 2021.

At this point it was announced by the Prime Minister during a 10 Downing Street Coronavirus television briefing to the nation that 15 million people from the most vulnerable categories in JCVI Priority Groups 1-4 had received a first dose of COVID-19 vaccination. Almost immediately a significant rise in household visitation rates were witnessed by our metric ‘HEngland,t’ across England, such that by the 7th March 2021 levels of household visitation were comfortably above the pre-pandemic baseline, even though coronavirus regulations had stayed the same.

Figure 2: Hex cartogram maps illustrating comparative levels of regional disparities in visitation rate across the whole COVID-19 period studied and for each of the three ‘National Lockdown’ periods. Source: https://www.nature.com/articles/s41598-021-02092-7/figures/2

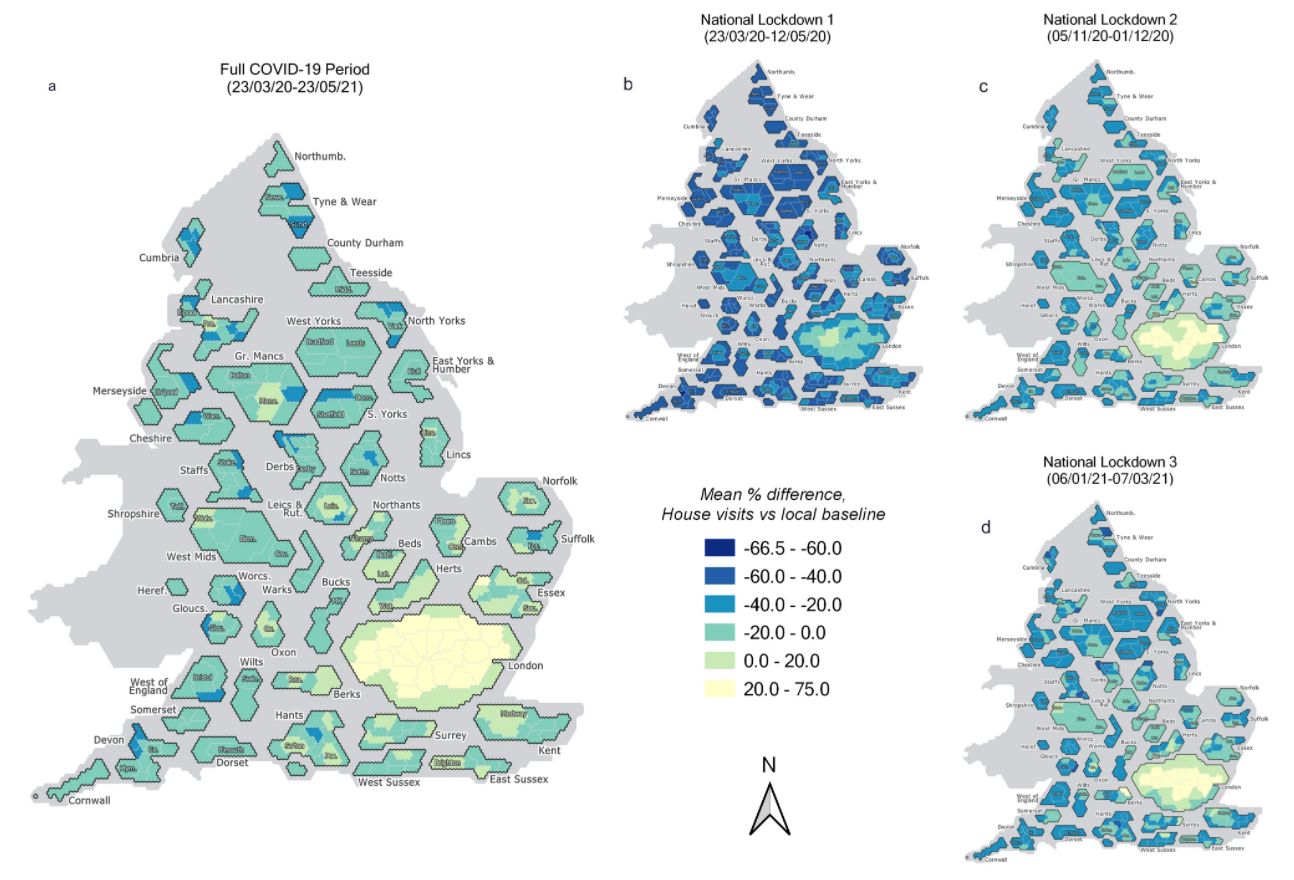
Figure 2 here illustrates the geographical variation in these household visitation rates for Local Authority Districts at LTLA scale, as mean averages across a) the entire COVID-19 period, and then, for b)-d), across the three National Lockdown periods respectively. These are presented as hex cartograms, prepared with assistance from the UK House of Commons Library. Some regional disparities are shown, notably between North and South, and between urban and rural areas. London boroughs, in particular, appear to have consistently higher relative rates of visitation against the pre-pandemic baseline than elsewhere in England.

Figure 3: Time-series showing levels of household visitation in two LTLA local authorities – Leicester and Liverpool – which experienced ‘local lockdown’ policies impacting household visitation, against the national level for England in grey. Source: https://www.nature.com/articles/s41598-021-02092-7/figures/4

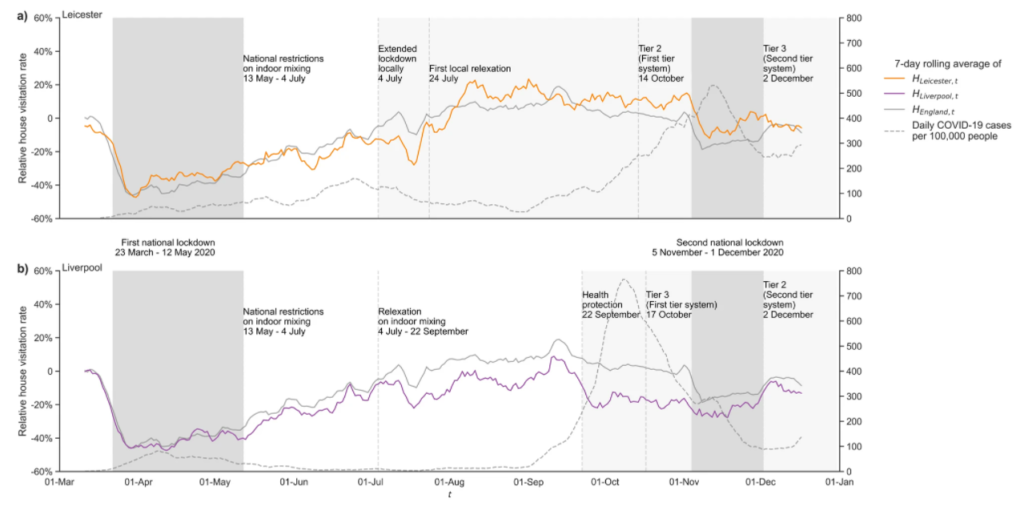
Figure 3 here finalises this summary of our key results, by showing the findings when applied to two individual local authority areas that experienced specific and rigorous local restrictions to tackle sudden outbreaks in cases over summer 2020 – ‘local lockdowns’ as they became known in England. Here, the cities of both Leicester and Liverpool are shown to have exhibited a likelihood of different profiles of adherence to ‘local lockdown’ measures on household visitation. In the case of Leicester, despite a great reduction in visitation when local lockdown was at its strictest compared to the national trajectory, a serious rise in household visits (to above the national level for England) occurs just around the time of the first relaxation on 1st August 2020, even though this didn’t revoke the restrictions prohibiting house visits. By contrast, in Liverpool house visits had stayed meaningfully below the national figure for England throughout the summer period, including after regional measures were introduced on 22nd September 2020.

Value of the research

The research had been directly designed to inform public policy, aligned with LIDA’s commitment to using data for public good. Understanding actual levels of likely aggregate adherence to pandemic policy was highlighted as an area of importance by the House of Commons Health and Technology Select Committees joint report into the UK coronavirus response – “Coronavirus: lessons learned to date” – published in September 2021.

Many activities driving virus transmission are intimately connected to the mixing and mobility of individuals. Our observational findings on behavioural responses in house visits will therefore allow public sector agencies to better understand how English populations responded to a range of lockdown impositions and relaxations, as well as allow us to see how these responses may have been complicated and/or influenced by concurrent public messaging and prevalent COVID-19 risks. A mix of past national and local lockdown policies can therefore be optimised and/or evaluated using our results. The Scientific Reports research paper disseminating the results was highlighted in the ‘Behavioural Science and Insights Unit Weekly Literature Report’ of the UK Health Security Agency (UKHSA) in late November 2021.

The findings received significant coverage in the national British press, featuring in Metro, The Daily Telegraph, The Independent, Daily Express, Daily Mail, The I paper, as well as in other national-scale publications including the Yorkshire Evening Post, The Conversation and current affairs magazine The Week. This was supplemented internationally by mass online coverage from Yahoo! and MSN. According to Altmetric, as of 20th January 2021, the research paper has also been shared on Twitter to a combined total of 2.69 million followers.

Quote from project partner Cuebiq

“We’re proud of the exceptional and novel research led by University of Leeds, not only because it created impactful public goods, but also because it was achieved with an uncompromising commitment to data privacy and governance.”

Insights

  • Measures indicate adherence to household visitation restrictions was relatively high overall but waned both within and between subsequent National Lockdowns in England. This is rare observational evidence for shorter- and longer-term ‘fatigue’ in compliance with COVID-19 restrictions, at various stages of the pandemic lifecycle.
  • About 15th February 2021, when the Prime Minister informed the nation that 15 million people from the most vulnerable in JCVI Priority Groups 1-4 had been vaccinated, a significant and unprecedented rise in household visitation rates was witnessed nationally, to above pre-pandemic base rates, despite lockdown regulations staying the same. This indicates that people may have paid meaningful attention to levels of protection carried by the most vulnerable members of British communities when determining their visiting activities, and/or have adhered far less to relevant pandemic regulations once vaccinated.
  • Measures of household visitation indicate that household visitation activity was responsive to prevalent COVID-19 risk, ahead of the implementation of restrictions (i.e. Alpha variant in December 2020), as well as before they were officially lifted (1st and 3rd National Lockdowns), offering evidence individuals may respond to a perceived personal and/or collective risk of COVID-19 infection over and above current government policy or guidance.
  • Local lockdowns in Leicester and Liverpool indicated a likelihood of contrasting profiles of adherence over time to ‘local lockdown’ measures prohibiting household visitation, also highlighting the potential of smartphone mobility data to indicate waning population-wide adherence in a single aggregated local authority area (where sample size N > 10 is consistently satisfied, to protect against the risks from Statistical Disclosure).
  • Cuebiq mobility data for England is geographically representative across a series of temporal and spatial aggregations, and across several points in the pandemic for our sample, even if other factors of social representativeness remain rightly unknown.

Research theme

Health informatics & urban analytics.

People

Mr Stuart Ross, LIDA Data Scientist Intern

Mr George Breckenridge, LIDA Data Scientist Intern

Dr Mengdie Zhuang, Lecturer in Data Science, University of Sheffield

Prof Ed Manley, Professor of Urban Analytics & LIDA Fellow

Partners

Data provider: Cuebiq Inc., NYC, Milan

Funders: LIDA intern work funded by the CDRC (Consumer Data Research Centre), so in turn by the ESRC (Grant ES/L011891) of UKRI. Broader research project also supported by i-sense, so in turn by EPSRC (Grant EP/R00529X/1) of UKRI

Images

Open Access: Images licensed under a Creative Commons Attribution 4.0 International License, from Ross et al. (2021) Household visitation during the COVID-19 pandemic. Scientific Reports. Springer Nature.

Household mixing during COVID-19 lockdowns

Household mixing during COVID-19:
research suggests adherence to lockdowns in England declined over time

The grim prospect of COVID-19 stay-at-home orders is back in the news, with a number of European countries having either introduced new restrictions or reimposed full lockdowns amid rising cases. These developments inevitably raise questions around how we can best shape public health policy to reduce virus transmission.

One key challenge is reducing “risky” interactions between people, such as household visits indoors. We know close proximity and inadequate ventilation increase the chances of the virus spreading, leading to rising rates of illness. Yet our understanding of these household visitation behaviours, and the effectiveness of policy to reduce them, is lacking.

So in our latest research, we analysed mobility data collected from almost one million people in England between January 2020 and May 2021, seeking to understand trends in home visits during the pandemic.

This data was collected via location-based mobile phone apps by the data company Cuebiq, who obtained consent from users for their anonymised data to be used for research purposes. Working with Cuebiq we were able to generate aggregate analyses without obtaining any individual or household data (that is, none of the data we used could be linked to specific people).

Our interest here was in regional and national trends in mobility, and how populations moved around during the pandemic. For each region we developed indicators of visitation rates to residential areas outside of usual home areas, and assessed how these rates varied from baseline levels set in January and February 2020.

What we found

We saw a rapid reduction in people visiting other residential areas during the first lockdown in March 2020. The average decrease over the duration of the first lockdown was 39.3%, while at the lowest point, this activity was 56.4% below baseline levels. Rates of interaction increased prior to the end of the lockdown on May 12, and continued increasing through the spring and summer. But this was a gradual return.

The allowance of support bubbles in June 2020 brought no significant increase in home visits, although a flattening of the rate during August 2020 may indicate that social gatherings moved to restaurants during the operation of the Eat Out to Help Out scheme, or to public outdoor areas with warmer weather. While visitation rates exceed those seen in our baseline months, we can’t tell whether these were indoors or visits to front and back gardens, nor whether the rule of six was followed.

Later national lockdowns saw higher levels of mixing compared to what we observed in March 2020. The second lockdown in November 2020 saw a 15.3% reduction from baseline on average. Activity increased quickly after the end of the November lockdown, potentially due to the run-up to Christmas. The third lockdown, in January 2021, saw around a 26.2% reduction until mid-February.

We observed a significant rise in visitation from mid-February onwards while the third national lockdown continued – within two weeks rising to 23.3% above baseline levels. This increase in activity aligns with the announcement that the UK had offered vaccinations to the first four priority groups, which may have given people confidence to return to social activities at this time.

Graph showing trends in visits to other residential areas.
In this figure, the dots represent the daily mobility data, while the orange line represents a seven-day average. Scientific Reports, Author provided

Taken together, the evidence suggests a slowly declining adherence to the stay-at-home rules as the pandemic went on. The underlying reasons for this will be multifaceted, summarised neatly as “lockdown fatigue”, but more precisely relate to increasing perceptions of safety in the face of the vaccine rollout, a need to re-engage in social activity, declining trust in government, and other personal stresses. These trends tell us we can’t simply pull the same policy leavers and expect to achieve the same outcomes as those seen in March 2020.

There is further variation in our findings when we look at different areas. In general, we observed lower levels of household visitation in rural areas, while some cities (London, Manchester and Cambridge, for example) regularly exceeded pre-COVID activity levels.

The reason for these differences is not clear. It could be linked to factors like household composition and personal circumstances, but further work is needed to better understand the complex demographic and household factors influencing these trends.

The implications

While there are some intriguing patterns of activity in this data, we must also apply plenty of caution in drawing conclusions. We can only speculate on the causes underlying the trends we observe, and the trends we see in England don’t necessarily reflect what has happened, or might happen, elsewhere.

Nevertheless, these findings add to our understanding of the impacts of pandemic policy, and highlight the need for nuance in crafting future interventions.

The patterns of household visitation we observed reflect the social complexities of the pandemic period. We must remember that household visitation does not equate to malicious noncompliance, and instead may point to the need for people to see each other for their emotional wellbeing.

While there are clear public health reasons to encourage caution in social mixing, this must be balanced against the negative outcomes of lockdowns and their potentially diminishing returns. Policy must be crafted to account for these nuances – supporting opportunities to socialise while avoiding higher risk interactions, responding locally, and adapting with the changing attitudes and circumstances faced by the population.


Ed Manley, Professor of Urban Analytics, University of Leeds and Mengdie Zhuang, Lecturer in Data Science, University of Sheffield

This article is republished from The Conversation under a Creative Commons license. Read the original article.

Measuring Ambient Populations during COVID-19 (Case Study)

Graph showing footfall data results

Measuring Ambient Populations during COVID-19 in Leeds City Centre
(Case Study)

The COVID-19 pandemic led to lockdowns being implemented all over the world, including in the UK.  The aims of the project were to investigate relevant data sources for modelling the ambient population of Leeds City Centre during COVID-19 and analysing the impacts that lockdown policies had on urban footfall.  The research builds on previous work undertaken with Leeds City Council by intersecting key dates from the English lockdowns and integrating these into machine learning models to assess the importance of different aspects of lockdowns. It also predicts what “business as usual” may have been like had there been no pandemic.

Analysis notebooks and scripts can be accessed at https://github.com/tbalbone31

Data and methods

Leeds City Council have been collecting footfall data for more than a decade. The data were wrangled and aggregated to create a history going back to 2008.  These data were then analysed alongside key lockdown dates to determine where trends in urban footfall intersected, raising questions about what aspects of these policies might have had the most impact.  The data cover a relatively small geographical area of Leeds City Centre and only reflect pedestrian traffic going past the locations identified by the cameras.  There are issues with data quality, such as potential double counting, periods of time with missing data and inconsistent file formatting, however it covers a large temporal scale and many problems can be worked around.

Google COVID-19 Community Mobility data was analysed as a potential alternative data source to the Council data.  It shows changes in mobility from a baseline for six different destinations (see the website for more details).  The smallest relevant spatial coverage is the Leeds City Region.  This was considered too large to isolate any changes impacting the city centre, making comparison of trends difficult.

The Council footfall data were resampled to show daily counts on which analysis was then conducted.  Visual analysis was undertaken to identify footfall trends over the course of the pandemic against key dates pertaining to the implementation and lifting of certain COVID-19 restrictions. These key dates were decided from research into when major legislation came into force or government announcements about restrictions were made.  The questions generated from initial analysis were then explored by creating a series of machine learning models using Random Forest Regression in the Python SciKit Learn package. 

The first model included a series of input variables to represent different aspects of society that had restrictions placed on them alongside other external conditions (such as weather, school/bank holidays, day of week, etc).  Variable importance was used to identify what (if any) aspects of lockdown might be significant in predicting future changes in footfall. The second model omitted any lockdown related inputs and was designed to make predictions on what “business as usual” might have been like had the pandemic not happened. 

Due to the inherently ordered nature of time series data, both models were validated using a method known as “Walk-Forward Validation” instead of the default Cross-validation included in SciKit Learn and often used on Random Forest Ensembles.  The implementation of Walk-Forward validation allows the model to be retrained after every prediction on the validation dataset, essentially “walking forward” through the time series.  This avoids potential data leakage because of the randomised nature of Cross-validation.

Key findings

The chart below shows the resampled footfall data intersecting with key dates from COVID-19 restrictions.

Key dates are shown as a dotted line with a number relating to a key.  Red zones indicate “official” lockdowns whilst orange represents periods where a variety of restrictions were in place but in the process of being lifted/introduced individually.  A summary of how this impacted footfall is below:

  • Footfall started to drop immediately after the announcement on 16th March 2020, no official restrictions implemented.
  • After non-essential shops and schools reopened on 15th June 2020, footfall started to rise again.
  • Footfall continues to rise through summer until around 22nd September 2020 when some restrictions were announced.
  • Footfall rises whilst Leeds is in tier 2 and 3, potentially because gatherings are only permitted in public spaces.
  • The second and third lockdowns drive footfall back down again until restrictions begin to ease again in April 2021.

The first machine learning model was intended to explore whether any lockdown variables would be significant in predicting future changes in footfall.  Variable importance (top 10) is shown below.

The most important lockdown-related features were indoor entertainment and non-essential retail.  Whilst this is only an initial model and not a definitive conclusion, it does help indicate what aspects of lockdown might have impacted pedestrian traffic in the city centre more than others.

The second model was designed to test how useful the data would be in predicting what “business as usual” may have been like.

There was little difference between error scores across different numbers of trees, so a compromise of the best score and least processing power (500 trees) was chosen.  The model predictions using this hyperparameter are shown below.

Results from this initial model are by no means definitive, however the potential to quantify how much footfall has been lost exists.  For example:

  • Average daily footfall in the lead up to Christmas (taken as 30th November to 24th December 2020) was approximately 36% lower than predicted.
  • Average daily footfall over the school holidays was approximately 63% lower than predicted.
  • Approximate footfall loss for individual Bank Holidays was also calculated.  Most recorded over 90% lower than predicted values except for the August Bank Holiday which was around 22% lower.

Value of the research

Initial analysis has already been delivered to Leeds City Council.  An aggregated dataset of footfall camera data has been created and is available on the Consumer Data Research Centre (CDRC) Data Store for future research.  The initial models developed can be used and refined by future researchers and develop more accurate predictions, whilst more specific time series packages can be explored.

Insights

  • Urban footfall and ambient population was significantly impacted by COVID-19 lockdown policies (as was intended).
  • Closure of Indoor Entertainment and Non-Essential retail appear to be the most important lockdown-related factors in predicting footfall change.
  • Consideration must be given to how time series data is processed in classic machine learning models such as Random Forests.

Research theme

Urban analytics

People

Tom Albone – Data Scientist Intern (LIDA)

Dr Nick Malleson – Professor of Spatial Science

Professor Alison Heppenstall – Professor in Geocomputation

Dr Vikki Houlden – Lecturer in Urban Data Science

Dr Patricia Ternes – Research Fellow

Partners

Leeds City Council

Funders

Consumer Data Research Centre

Population movement in Greater London during the first lockdown

Population movement in Greater London during the first lockdown

Researchers from UCL Geography with the Consumer Data Research Centre (CDRC) have published a new study that uses smartphone location data to explore activity patterns in Greater London during the first lockdown.

Professor James Cheshire and PhD researcher Terje Trasberg used anonymised smartphone data from over 300,000 devices to measure population mobility from the early period of the pandemic last March to the easing of the first lockdown last summer.

The study aimed to identify socioeconomic characteristics that could explain the differing rates of decline in population movement across neighbourhoods.

(Credit: Mary Hinkley)

Their analysis revealed the division between areas dominated by white- and blue-collar jobs, the latter showing a much smaller reduction in activity during the lockdown.

This finding highlights a divide between those who can work from home and those with jobs that must be carried out on-site. This has important implications for transport, retail and post-COVID-19 recovery policy.

Terje Trasberg said: “By linking the mobile location data to the broader demographic characteristics, we were able to provide additional insights into the impacts of mobility restrictions in different demographic groups across Greater London.

“We hoped that our analysis can offer a more nuanced insight into why the effectiveness of social distancing interventions appeared to vary between areas. The data also signals those areas likely to require the most support during a post-pandemic recovery phase as activity is slower to return.”

For more information on the study, read the CDRC’s data story. The full study can be accessed here.

(First published at www.geog.ucl.ac.uk/news-events/news/new-study-explores-population-movement-in-first-lockdown, written by Samuel Kelly, Communications & Marketing Officer, UCL Geography)