Researchers demonstrate the value of consumer data for population dynamics and utilities research.
A team of five researchers, based in Liverpool’s Geographic Data Science Lab (GDSL), recently took part in a three-day hackathon organised by O2, Virgin Media and Northumbrian Water. The hackathon, which took part in a hybrid online/remote format, comprised teams from many different backgrounds, including app design, UX, digital services and academia.
The team, led by Patrick Ballantyne, comprised of GDSL PhD students; Danial Owen and Sian Teesdale, and CDRC researchers; Zi Ye and Meixu Chen, with project support from CDRC Deputy Director, Professor Alex Singleton.
Utilising some impressive datasets from O2/Virgin Media and Northumbrian Water the team presented their take on “The value of consumer data for population dynamics and utilities research”.
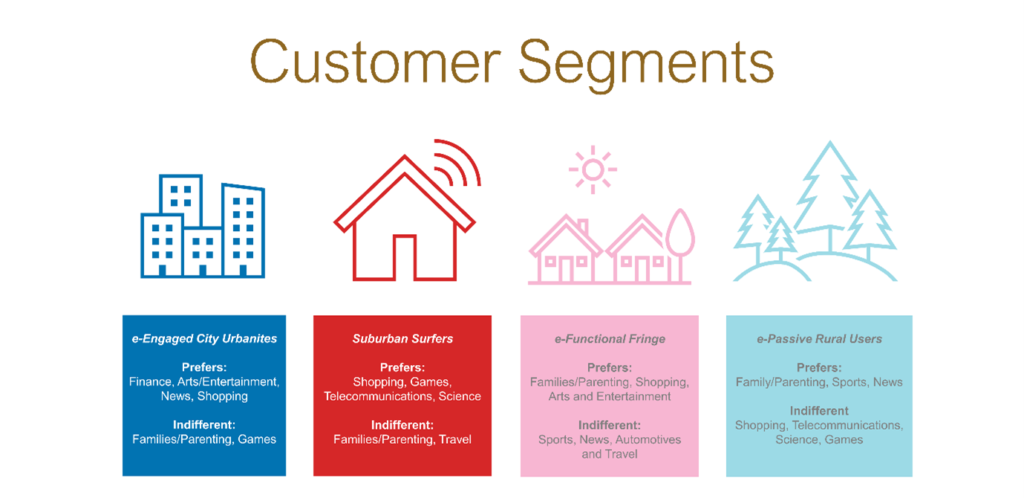
Over the course of three days, the Liverpool team constructed a UK customer geodemographic, using data on audience insights from O2/Virgin Media, to capture the search interests of O2/Virgin Media customers.
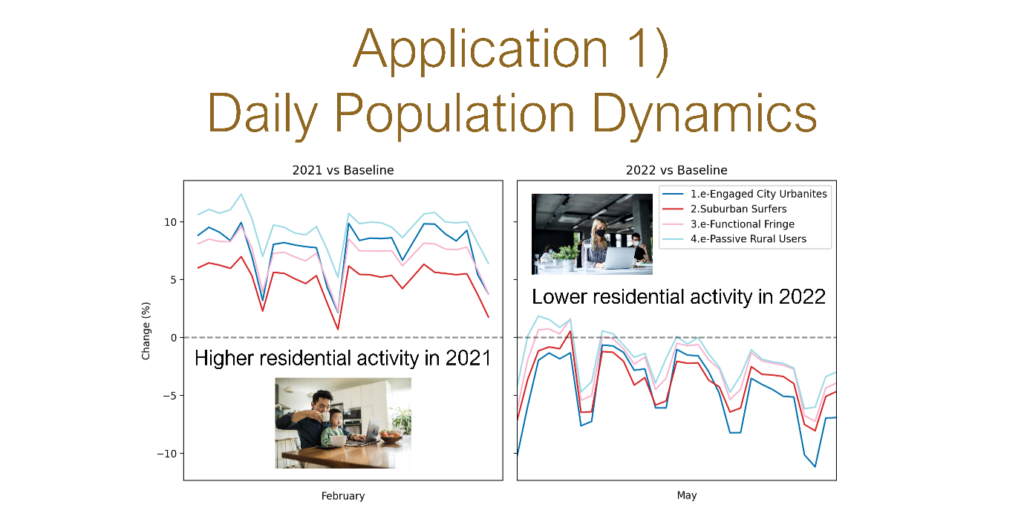
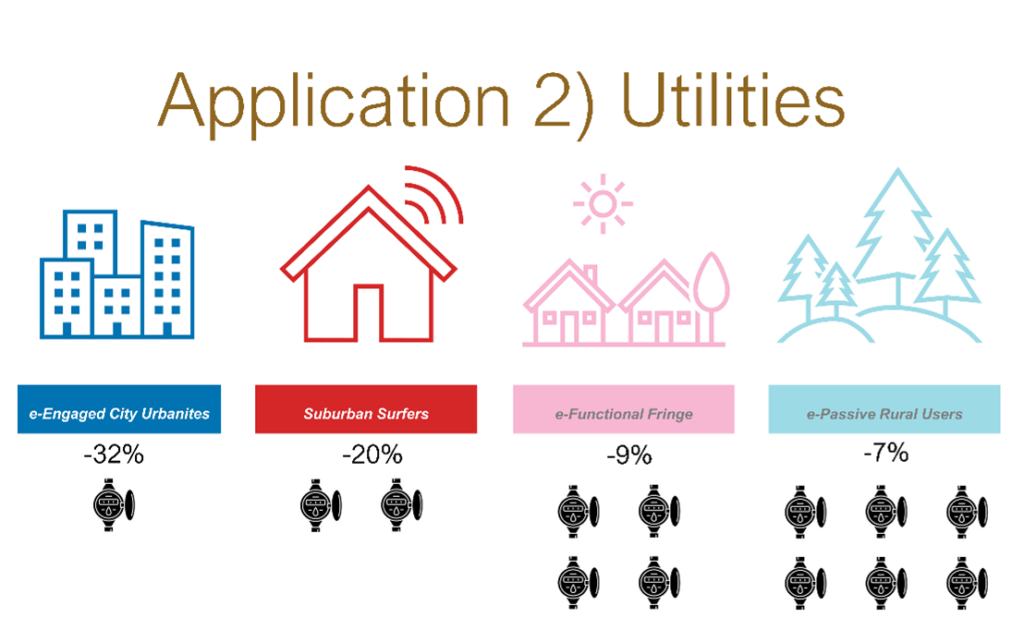
They then applied their customer geodemographic, utilising the excellent O2 motion and Northumbrian water datasets, to demonstrate applications to population dynamics and utilities research. They investigated the recovery of different residential areas following the COVID-19 pandemic (see application 1), and the applications of geodemographics for selective targeting of water meters where they would provide better value for customers (see application 2).
Team leader Patrick Ballantyne reflected upon the experience: “This hackathon was a great opportunity to collaborate with some of my excellent colleagues on a short and exciting project, drawing upon our individual skills and talents. It enabled us to get a better understanding of how new sources of consumer data, such as O2 motion, can be used to provide solutions to societal problems”.
It is hoped that the CDRC will establish a partnership with O2/Virgin Media, enabling researchers to use their data, to provide solutions and empirical evidence to help answer societal problems.
CARTO add CDRC dataset to their Spatial Data Catalog and use it to explore UK retail centres
CARTO, one of the world’s leading location intelligence platforms has added CDRC’s Retail Centre Boundaries dataset to its Spatial Data Catalog. The dataset contains spatial boundaries for Retail Centres across the UK, as well as measures of supply vulnerability, online exposure, a clone town measure, E-resilience, and a hierarchical classification. It is based on a hexagonal H3 grid, designed for spatial analysis at scale. This gives the dataset some unique benefits when cross-analysing with other datasets.
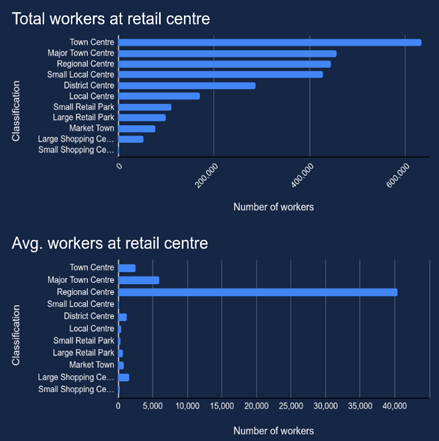
Miguel Álvarez, Lead Data Scientist and Helen McKenzie, Geospatial Advocate at CARTO took advantage of this to explore UK retail centres. They looked for patterns by cross-analysing CDRC data with external datasets from CARTO’s extensive Spatial Data Catalog. One insight from their analysis is that, on average, Regional Centres have by far the highest number of employees per centre, averaging at around 40,000 people working within them. However, in total Town Centres (e.g. Arnold, Nottingham) are by far the biggest employer with over 600, 000 people working there.
Another CDRC dataset available on CARTO’s Spatial Data Catalog is our “Retail Centres Typology”, which is a previous version of Retail Centre Boundaries, based on 2015-18 data. However, the two datasets are not directly comparable, as they contain different information and geometric types.
If you want to go exploring using a CDRC data please visit our data catalogue, which has over 80 datasets covering the following topics: Population & Mobility; Retail Futures; Transport & Movement; Finance & Economy; and Digital.
The CDRC team were delighted to collect four awards at the University of Leeds inaugural Research Culture and Engaged for Impact Awards earlier this week.
The awards celebrated the role that all members of the research community – participants; collaborators and partners; academic, research and technical staff; professional services and students – have to play in developing and promoting a positive and inclusive research culture, as well as contributing to the impact our research makes locally, nationally and internationally.
CDRC Co-Director, Professor Mark Birkin, commented “CDRC has prospered as a research centre through an inclusive approach with a commitment to invest in the future of all team members, and through the development of robust partnerships with outside organisations. I am delighted that these values have been recognised and validated so generously through the Research Culture and Impact Awards at the University of Leeds.”
Engaged for Impact – Building partnerships and networks
This award recognises the importance of partnerships and networks to bring about change.
Winning project: Building networks with supermarkets to assess healthy and sustainable consumer diets
This collaboration with the IGD (Institute of Grocery Distribution) and their 20 retailer and manufacturer members has enabled us to trial large scale consumer interventions that incentivise healthy eating. This partnership has built on previous collaborations such as the strategic partnership between Leeds Institute for Data Analytics and Sainsbury’s and the ESRC Strategic Network for Obesity cementing a leading reputation for trusted cross sector collaboration to effect change in the food system.
Team members: Dr Michelle Morris, Dr Victoria Jenneson, Dr Stephen Clark, Diogo Ann Onuselogu, Alexandra Dalton, Francesca Pontin, Hannah Skeggs (IGD), Becky Shute (Sainsbury’s), Paul Evans and Dr Emily Ennis.
Engaged for Impact – Finding a better way
This award recognises all the ways in which new thinking and acting, new products and knowledge, lead to creating and galvanising change and innovation.
Runners-up: Building an online nutrient profile model calculator for implementation of HFSS legislation
This research revealed shortfalls in available nutritional information and practical implementation guidance for the UK Government’s Nutrient Profile Model (NPM). The NPM will be used as the basis for restricting the placement of certain foods in supermarkets as part of the UK Obesity Strategy – but data availability does not meet legislative purposes. Having consulted with industry nutritionists from retail and manufacturing companies to develop recommendations for industry and the UK Government, the team are now developing an online NPM calculator to support implementation of legislation in an open access, scalable and transparent way.
Team members: Dr Victoria Jenneson, Dr Michelle Morris and Rosalind Martin.
Engaged for impact – Caring for the future
This award recognises research impact that’s likely to build over time, leading to a fairer, safer and more equitable world and healthier environment.
Winning project: Understanding and improving the carbon footprint of school meals in Leeds
Working with Leeds City Council, this project changed council practice for designing climate-friendly school menus, by co-creating a Carbon Calculator assessing food’s environmental impact. In collaboration with the Leeds Social Sciences Institute, the project team were able to design a suite of engagement activities supported by the ESRC-funded Local Accelerator Fund. This allowed the team to use data from the tool to develop an online game and classroom activities to encourage primary school children to think about the planet’s future through their own food choices.
Team members: Dr Emily Ennis, Alexandra Dalton, Dr Michelle Morris, Mel Green, Kevin Mackay (Rethink Food), Polly Cook (Leeds City Council), Ellie Salvidge (Leeds City Council) and Gillian Banks (Leeds City Council).
Research Culture – Open research and impact
This award recognises initiatives that increase the transparency, collaboration, inclusivity, reproducibility and efficiency of research processes to build trust and accountability. It focuses on aspects such as open access and open data, and promoting the use of open platforms for sharing research data, activities, outputs and impact.
Winning project: Opening up data science to solve real-world problems
CDRC Leeds were recognised for building trust and accountability through rigorous governance and infrastructures, including our virtual research environment (Leeds Analytics Secure Environment for Research) and our research management process. As well as encouraging transparency and reproducibility by creating diverse types of derived data products, aimed at diverse groups, from policy makers and researchers, to activists and children.
“[The CDRC]appears to be a beacon of good practice and it would be useful to transfer the ways of working / methods and approaches to infrastructure and skills to others.”
Research Culture Awards Judging Panel
Team members: Professor Mark Birkin, Professor Ed Manley, Dr Nik Lomax, Dr Emily Ennis, Adam Keeley, Dr Pete Baudains, Kylie Norman, Robyn Naisbitt, Mel Green, Oli Mansell and Paul Evans.
CDRC’s Dr Michelle Morris and Kylie Norman were also included in an award won by our colleagues at Leeds Institute for Data Analytics:
Research Culture – Equality, diversity and inclusion in research
This award recognises initiatives that make positive changes to embed a culture of equality, diversity and inclusion in research.
Winning project: Championing recruitment for diversity on the LIDA Data Scientist Development Programme.
Team members: Kylie Norman, Dom Frankis, Dr Michelle Morris and Professor Nick Malleson.
Dr Emily Ennis, CDRC Research and Impact Manager commented “These awards demonstrate CDRC’s commitment to fostering open, collaborative, and co-designed research with our external partners in a way that uses data science for public good. It has been inspiring to see our research projects recognised for their impact to society beyond academia, thanks to our partnerships in retail, education, local government, the charity sector, and education, among others.
Additionally, we have also seen recognition for research led by data scientists across a range of career stages and disciplinary backgrounds, as well as appreciation for the integral role professional services and technical staff play in building open and impactful research within CDRC.”
New paper – identifying dietary patterns in supermarket transaction data and their nutrient and socioeconomic profiles
Poor diet is a leading cause of death in the United Kingdom (UK) and around the world. Methods to collect quality dietary information at scale for population research are time consuming, expensive and biased. Novel data sources offer potential to overcome these challenges and better understand population dietary patterns.
In a recent paper in Nutrients CDRC researchers Dr Stephen Clark and Dr Michelle Morris used 12 months of supermarket sales transaction data, from 2016, for primary shoppers residing in the Yorkshire and Humber region of the UK (n = 299,260), to identify dietary patterns and profile these according to their nutrient composition and the sociodemographic characteristics of the consumer purchasing with these patterns.
Results identified seven dietary purchase patterns that they named: Fruity; Meat alternatives; Carnivores; Hydrators; Afternoon tea; Beer and wine lovers; and Sweet tooth. On average the daily energy intake of loyalty card holders – who may buy as an individual or for a household – is less than the adult reference intake, but this varies according to dietary purchase pattern.
In general loyalty card holders meet the recommended salt intake, do not purchase enough carbohydrates, and purchase too much fat and protein, but not enough fibre. The dietary purchase pattern containing the highest amount of fibre (as an indicator of healthiness) is bought by the least deprived customers and the pattern with lowest fibre by the most deprived. In conclusion, supermarket sales data offer significant potential for understanding population dietary patterns.
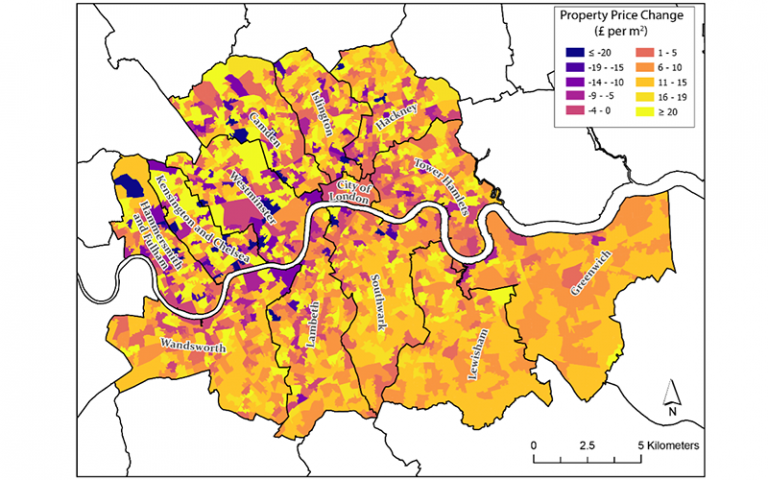
London house price increases linked to areas with more Airbnbs
Areas in London with more Airbnb listings are more likely to see increases in house prices, according to a team of researchers from the CDRC at UCL.
In a study published in Environment and Planning B: Urban Analytics and City Science, UCL researchers were able to track the relationship between the number of properties listed on the short-term letting platform and the changes in house price in the area – measured in £ per square metre – using a comprehensive listings database and house price data.
Across Central London, researchers found a tendency towards increased house prices in areas with more Airbnb listings, with large parts of Kensington and Chelsea, Westminster and Camden exceeding rises of £20 per m2 per month from January 2015 to May 2018. The highest increases across the city as a whole occurred north of the River Thames, with more modest growth towards the South and East.
Despite the generally positive trend, the findings also revealed important contrasts where some areas had a negative association with house prices and experienced reductions of more than £20 per m2.
Whilst more research is needed to understand why such differences occur, the findings paint the most detailed picture yet of Airbnb’s interaction with the London housing market. With boroughs broken down into smaller areas containing between just 400 and 1,200 households, the researchers argue that the level of granularity presented provides local decision-makers with the detail needed to produce better, more localised, housing policy to inform regeneration strategies.
Professor James Cheshire (CDRC Deputy Director, UCL) said: “The housing market in London is complex and there is still a lot we don’t know about how platforms such as Airbnb are interacting with local price fluctuations. Thanks to the detail in this analysis, we can begin to take a closer look to understand some of the patterns that are emerging and the reasoning behind these.”
Whilst the data used in the analysis span January 2015 to May 2018 and capture a pre-pandemic city, the researchers believe their findings could help to inform London’s Covid-19 recovery.
“Central London’s rental market has cooled dramatically over the last year, as many workers and tourists have left the city during lockdown, so we have an opportunity to influence its recovery,” Professor Cheshire added. “Policymakers can either help areas return to business as usual – or take a closer look at both the costs and the benefits that platforms like Airbnb can bring to communities”.
Currently, London is one of a handful of cities on Airbnb to have restrictions on the number of days “entire home” listings can be occupied per year, which is no more than 90 days. Introduced in 2017, this measure was implemented by the platform to ensure the sustainable and responsible growth of home sharing in the city.
The research team note that previous studies have found that Airbnb takes up around 1.4% of the total housing supply in London.
The data used in the study were supplied by the ESRC-funded Consumer Data Research Centre and the analysis was conducted by James Todd (UCL Geography), Dr Anwar Musah (UCL Institute for Risk & Disaster Reduction) and Professor James Cheshire (UCL Geography and Consumer Data Research Centre).
To celebrate World Book Day we spoke to some of our Data Science Interns about their favourite reads.
George, Rosalind, Stuart and Simon shared the stories they loved to read as a children and teenagers, and discussed the books that have had the biggest impact on their careers to date.
‘Who Was Isambard Kingdom Brunel’ (2006) by Amanda Mitchison – I think I read this when I was about 8, which is crazy looking back! A short biography of Brunel and his engineering feats which I think instigated a life-long fascination with our collective journey into the depths of underground civil engineering.
What was your favourite book as a Teen?
‘Population 10 Billion’ (2013) by Danny Dorling – I’ve always loved Danny Dorling’s writing and this book on demography represented a cornerstone of my reluctantly-optimistic teenage outlook. Its insight that future global resource issues are mostly a product of imbalances in ‘consumption’ rather than global ‘overpopulation’ remains, in my personal view, underappreciated.
Favourite data related book?
‘Urban Analytics’ (2017) by Alex Singleton, Seth Spielman & David Folc – This concise textbook served as my gateway into truly understanding the diversity and dynamism of urban analytics, perfectly pitched as an introductory text.
Book that has had the greatest impact on your career to date?
‘Imagined Londons’ (2002) by Pamela K. Gilbert (eds). – At a time when I needed it most, this book put theoretical rocket-boosters into my undergraduate dissertation on urban geography, which in turn contributed to my BA classification very helpfully!
Stuart….
What was your favourite book as a child?
Where’s Waldo by Martin Handford
What was your favourite book as a teen?
This one would be The Old Man and the Sea by Ernest Hemingway
Favourite data related book?
Python for Dummies by Stef Maruch – Great for learning the basics of Python and I still refer back to it from time to time to brush up before an interview.
Book that has had the greatest impact on your career to date?
An Introduction to Species Distribution Modelling (SDM) Using QGIS and R by Colin D. MacLeod – This is the first book I actually followed all the way through and used as a tutorial to teach myself the basics of SDMs.
Any from the Horrid Henry Series by Francesca Simon – I remember reading so many of these as a child, and reading them over and over again!
What was your favourite book as a teen?
Gerrard: My Autobiography (Steven Gerrard) – I have to confess I did not read enough during my teenage years, but remember almost exclusively reading footballer’s autobiographies when I did pick up a book! As a Liverpool fan this is the only choice really!
Favourite data related book?
Algorithms of Oppression: How Search Engines Reinforce Racism (Dr Safiya Umoja Noble) – I attended the Open Data Institute 2020 Summit, and found the talk given on this subject very interesting and thought provoking, so I went ahead and bought the book to learn more about the current information ecosystem.
Book that has had the greatest impact on your career to date?
Spatial Microsimulation with R by Robin Lovelace and Morgane Dumont – I followed this free book closely to produce a spatial microsimulation for assessing Vulnerability to Personal Carbon Allowances for my GIS Master’s Dissertation, something that pushed me to apply for this role as I enjoyed the work so much!
Rosalind, what was your favourite book as a child?
Anything by Michael Rosen.
What was your favourite book as a teen?
The Count of Monte Cristo, by Alexandre Dumas.
Favourite data related book?
Moby-Duck: The True Story of 28,800 Bath Toys Lost at Sea, by Donovan Hohn – Set within an entertaining true story, this book introduced me to using data and spatial mapping to understand real events.
Book that has had the greatest impact on your career to date?
How to Lie with Maps, by Mark Monmonier – As an aspiring geographer at the time of reading, Monomier was the first to teach me to develop a critical eye when looking at maps, and how to differentiate the good from the bad in a context where all maps must lie in one way or another.
Data considerations for the success of policy to restrict in‐store food promotions: A commentary from a food industry nutritionist consultation
A recently published paper from CDRC researcher Vicki Jenneson discusses new plans to restrict in‐store price and location‐based promotions of less healthy foods and drinks in the UK aimed to encourage healthier choices. With responsibility for implementation likely falling to food retailers, it is important to understand the feasibility of implementation and to ensure policy success. To ensure compliance, retailers will need to assess which products are restricted under the legislation. The large number of products in retailers’ portfolios poses a problem of scale.
A recent research case study found the data available to retailers to be insufficient to accurately apply the rules‐based approach set out by the policy proposal. Misclassification would result in some less healthy products being incorrectly promoted and vice versa. Problems with implementation feasibility have the potential to undermine the public health goals of the legislation. Interviews were carried out with nutrition representatives from the UK food retail and manufacturing sector, to understand the real‐world implications of the proposed legislation.
Industry nutritionists recommended a review of the use of the UK’s Nutrient Profiling Model as the legislative basis, proposed data‐related solutions to implementation problems and suggested a need for shared retailer‐manufacturer responsibility, given the context of data availability.
Hi, I’m Simon, one of the LIDA Data Scientist Interns, in the unique position of splitting my working week between home working and working in one of LIDA’s Safe Rooms (for use when analysing controlled data in secure conditions without internet access). This is because I am currently working on a project with the Office for National Statistics (ONS), funded by Administrative Data Research UK (ADR UK) – The Local Data Spaces Pilot.
The Local Data Spaces Pilot project aims to develop novel insight for Local Authorities in response to the COVID-19 pandemic, providing up-to-date, high-quality analysis at granular levels. Principally, we will use health data from the Test and Trace programme, non-health data provisioned by the ONS and the Joint Biosecurity Centre (JBC) and Local Authority ingested data to create novel and innovative insights in support of individual Local Authority policy needs. We aim for this work to inform impact monitoring, allocation of resources and a better understanding of the pandemic at local levels.
In this article I’m going to share some initial thoughts and feelings on how I’ve found building new working relationships remotely through the Programme, the ways in which my weekly routine has taken shape and the pros and cons of hybrid working.
At the beginning of this project I felt very overwhelmed at the thought of a newly-appointed Data Scientist Intern being thrown in at the deep end with expert colleagues, so I can only thank the rest of my team for their help and support throughout! The ADR UK Support Team is made up of three other academic researchers, among them Post-Doctoral Researchers and Lecturers. The wider support team spans Research Analysts, Directors and high-level leadership colleagues from the ONS and ADR UK. Across the four stakeholders, we have varying engagement.
Typically, the ADR UK Support Team will communicate almost daily, discussing the particular deliverables and current progress. We meet with the JBC, ADR UK and ONS on a fortnightly basis to provide a high-level overview. Insights from these fortnightly meetings are then disseminated to a wider group of stakeholders, and serve as a touch-point for mitigating risks- as it is important to remember this is a pilot study, so there is opportunity to learn what works best!
This project is inherently collaborative; we are working with and for Local Authorities, to provide them with the datasets, code and outputs related to the COVID-19 pandemic. By learning the skills, ways of work, and personalities of the other team members, I believe we have built a strong team dynamic, and one that fosters collaboration, innovation and insight, across the four actors involved.
I began this LIDA Data Scientist Internship having never had a full-time post, and I still have the bizarre knowledge that my colleagues of nearly 5 months are people I am yet to meet in the flesh.”
However, I really feel I know them well, and feel we all made a concerted effort to gel together. The Data Scientist Interns have a scheduled Friday evening after work social call, for us to chat and wind down after the week, and also scheduled Coffee Breaks in our calendars: a 30-minute break 3 times a week to get away from our work and simply chat to others in a similar position.
Whether this might be an informal discussion on the project itself, asking for help, or what everyone did at the weekend, these Coffee Breaks ensure we don’t feel isolated while working from home alone, foster friendships and work-place groups and enable us to provide help and support to others. Personally, I have been made aware of the Open Data Institute Conference and various training courses, events and online webinars through fellow Data Scientist Interns, and have sought their help with coding issues, and data visualisation techniques in R. The wealth of knowledge across the Data Scientist Interns is fantastic, and by ensuring we all have strong relationships, we know who to talk to for support on a particular issue, ensuring the collaborative aspect of the Data Scientist Internship Programme, even remotely!
At the time of writing this article, I am typically working four days a week in the Safe Room (for use when analysing controlled data on the ONS Secure Research Service without internet access) in LIDA and one day a week from home (the latter without access to the Secure Research Service where our project and data reside).
The routine in the Safe Room is one I am still getting used to and has definitely resulted in a different and perhaps more productivity-driven way of working. This is because I work in the Safe Room alone, and with the knowledge that this is my only opportunity to access the data being used on the project. I really feel productive in the Safe Room – the lack of internet access, distractions, and even colleagues enables me to power through the research. However, I feel the burden to work, all day 9am-5pm, more keenly whilst working in the Safe Room. Whereas in normal office-based employment, I might be stewing over a coding problem during lunch or a quick break, I find that without someone to talk with, or simply get outside for a quick walk with, I miss escapism and time away from a screen, and often find myself forsaking breaks at the expense of continuing research. Before writing this blog post, I hadn’t really put this into words, so this self-reflection has really highlighted this.
Many of you might be wondering how I cope without access to the internet in the Safe Room, particularly when completing research using R. I have to say this has been the biggest challenge of the work. I liken this to completing an R exam, no notes, no internet, simply your own ability! The ONS also allows you to import code into the Secure Research Service, so if I know what I will need to do next, on my day at home I can prepare the code and ask for it to be imported. The need to leave the room to search for the particular syntax of an issue can sometimes be frustrating, but it is at the expense of access to wonderful, highly granular data. However, it does ensure I get in my steps for the day, so that’s a little win!
The single day I am currently spending at home, without access to the project space is a welcome change. The flexibility to work my hours in a different format enables me to get outdoors for a long walk during daylight, something I sorely miss inside the office. This agile method of working, provides a different focus on my home-working days and gives me the freedom to continue personal development and research any techniques or code required, providing a space for more creative thinking around the challenges encountered. I sometimes find that within the Safe Room, your head begins to race around searching for answers and it is easy to get overwhelmed. By allowing myself time away from the screen and time outdoors, I am able to re-focus and consider how best to use the remaining 2 days in the Safe Room.
Hybrid Working – the New Normal?
Having started my first full-time post during the pandemic, I have only worked virtually, or worked alone in an empty office. This pandemic has shown that high-quality research can be completed collaboratively, remotely and across different regions – so I see no reason why this should not be a possibility moving forward. I like the agility of being able to adapt my working hours, particularly during these winter months. The ability to get outside during daylight hours really helps me, but I would also love to see some more faces in the office in the future, and hopefully meet all of my colleagues in the flesh! Finally, I simply hope that, moving forward, working patterns will retain a level of flexibility to enable employees to find a hybrid approach that best suits them.
The recent Channel 5 program “Inside Waitrose” again highlighted the existence of a ‘Waitrose effect’ on the UK housing market.
But what exactly is the effect, and does it apply to homeowners and renters alike? We asked CDRC Researcher, Dr Stephen Clark, to explain.
What is the ‘Waitrose effect’?
The program reported work by retail analyst James O’Malley which identified the location of ‘posh’, high personal income neighborhoods and found that the top 10 poshest neighborhoods contained a Waitrose.
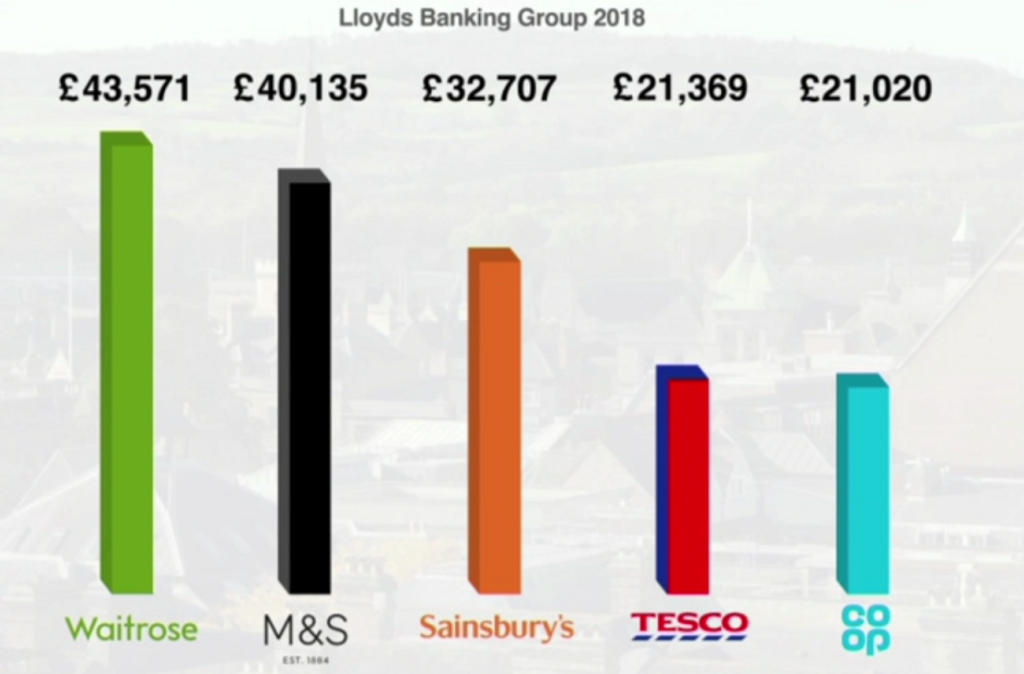
The most often cited study for this ‘Waitrose effect’ was conducted by Lloyds bank in 2018 that quantified the impact of various retail brands on local house prices. This study compared the average house prices in the catchment of various supermarket brands with equivalent prices from farther afield and associated the difference to the presence of the supermarket brand. They found an impact for most major brands, but the highest was for Waitrose, a +9.3% premium.
Does having a Waitrose or M&S nearby really make such a difference?
Well, what the study did not do is try to control for the other aspects that might drive this difference, for example Waitrose stores may be located close to larger, more expensive properties than in the wider area. This means that the Waitrose effect reported may also be picking up other differences between the local neighborhood and the wider areas.
Whilst this Waitrose effect on house sales is well reported, there is less understanding of the impact of retail brands on other aspects of the English housing market, such as rental properties. This gap in knowledge is what our recent study aimed to fill.
Also, we decided to control for other aspects that make properties more desirable, such as the size of the property, the affluence and character of the neighborhood, access to services and the quality of local schools. This allows us to distill out many of these ‘confounders’ to hone in on a true retailer association.
Another aspect of our study is that we extended the understanding by examining different effects from smaller ‘convenience’ locations and more traditional larger store locations. This is important because the attractiveness of each type of location is different – the range of goods is more limited in convenience stores, but they are allowed to open for longer hours on Sundays.
What data did you use?
For our study we used two main sources for our data. One was a database of over 1 million private rental listing prices taken from the popular Zoopla property listing site, provided by the Consumer Data Research Centre, from July 2014 to December 2015.
The second was the location of retail brands provided by the property analytics company GEOLYTIX, which allowed us to identify the location of stores, their brands and their size. Using powerful analysis software we were able to associate with each property listed for rent in England, the brand of the closest convenience store and the brand of the closest medium to large store.
Other ‘confounding’ information on the size of the property (bedrooms, bathrooms and reception rooms), the affluence of the neighbourhood (through a classification of areas and local incomes), the distance from the property ‘hot spot’ of West London, the quality of local schools and the access to transport hubs was also attached to the property. This comprehensive and diverse database on over 1 million properties allowed us to use regression analysis to measure the association of each of these aspects on the listing price of the property.
So does the ‘Waitrose effect’ have a similar impact on the rental market?
Our model produced reassuring insights. The confounding variables all estimated the correct magnitude and influence on rental prices, e.g. higher rents for larger properties, in more affluent areas that are closer to good schools and railway stations. And the retail findings were also insightful.
Convenience store
Properties that had a convenience store within a handy 500m walking distance showed a positive impact on rental prices, after controlling for all the above confounders, over having no convenience store close by.
The biggest effect associated with a brand was for the little Waitrose brand with a 5.6% increase in rental prices. The impact for Marks and Spencer Simply Food stores was almost as high, with a 5.1% increase. The smallest increase was for a small Co-operative store of just +0.8%. Of the Big-4 retailers, the local brand for Tesco express was favored over Sainsbury’s Local stores.
Medium to large store
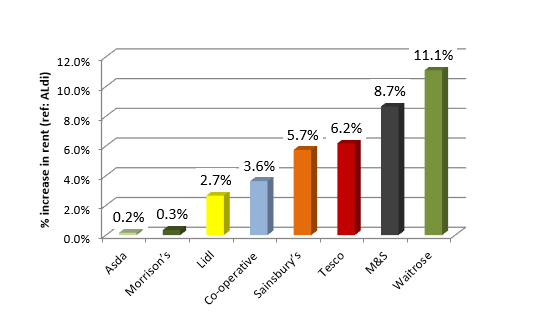
Looking at the influence of which brand of medium to large store was closest to the property (irrespective of distance) and measuring this relative to the Aldi brand, we again see distinct differences by brands. The premium is always positive, meaning that all brands command a premium (all be it small in some case) over the Aldi brand.
Again the Waitrose effect is most pronounced with an associated 11.1% increase in private rental prices. With the house sales data, Lloyds bank estimates a 9.3% increase. The second highest brand is again Marks and Spencer, with an 8.7% increase. Two of the Big-4 retailers, Asda and Morrison’s only showed a small premium over having an Aldi store as the closest retailer.
One interesting finding is that Lidl, Aldi’s fellow discounter, shows a price premium over an Aldi and these two Big-4 retailers. It will be interesting to work out why this might be the case.
Is the ‘Waitrose effect’ London centric?
Waitrose traditionally has its roots in Southern England, particularly around London and London is recognised as an expensive location for property, both to buy and rent. This then leads us to ask are we just picking up an affluence effect from South East England for our brands?
Well, the reason we introduced the confounders was to try and capture any affluence effect in the South East using other information, such as the local income levels, the affluence of the neighbourhood, its socio-demographic make-up and critically, a distance from West London to capture in this one term the reduction in private rental prices as one moves away from West London. What is left in the variation in rents after these confounders have been accounted for is then tested against the retail brands.
What about the future?
Our study gives us a good understanding of the interaction between retail provision and rental prices in the recent past, but this relationship is clearly dynamic. Questions arise around whether in the post-Covid-19 living, working, leisure and retail landscape, will city centres and associated rental housing be less attractive and likely to remain so? Conversely, are more localised residential areas with associated small high streets now more desirable, with a knock on positive impact on convenience grocery stores and nearby rental costs? Has consumers’ experience with on-line retailing weakened the geographic link between where people live and shop – or have local in-store loyalties transferred to into the e-retailing sphere? Clearly this is an active and important area of research that is best facilitated by access to the types of novel data used here.
Do you have any plans for further work in this area?
In this study, for statistical reasons, we can only really claim an association between the retail brands in a neighbourhood and the rent for local private rental properties. To claim an actual causation requires more sophisticated statistical techniques. One technique that we are actively investigating is Propensity Score Matching which attempts to mimic a traditionally randomised control trial type experiment. Here we are attempting to set up a group of control areas (that do not have the retail brand present) and a group of treatment area (that have the retail brand present). If these two groups can be made to look ‘similar’ in every respect other than the presence of a retail brand, then any difference in the rental price may be attributed to the presence of the retail brand. Initial investigations are proving positive.
Further Information
For further information or a copy of our article, please contact Stephen Clark.
Markus Löning is a PhD student at UCL with the CDRC, and is one of the lead developers of sktime – a Python library for time series machine learning. Time series analysis is a challenging area and many existing tools do not work well with time series data.
Solving data science problems with time series data in Python is challenging.
Why? Existing tools are not well-suited to time series tasks and do not easily integrate together. Methods in the scikit-learn package assume that data is structured in a tabular format and each row is i.i.d. — assumptions that do not hold for time series data. Packages containing time series learning modules, such as statsmodels (https://www.statsmodels.org/stable/user-guide.html#time-series-analysis), do not integrate well together. Further, many essential time series operations, such as splitting data into train and test sets across time, are not available in existing Python packages.
sktime is an open-source Python toolbox for machine learning with time series. It is a community-driven project funded by the UK Economic and Social Research Council (https://esrc.ukri.org/), the Consumer Data Research Centre (https://www.cdrc.ac.uk/), and The Alan Turing Institute (https://turing.ac.uk/).
sktime extends the scikit-learn API to time series tasks. It provides the necessary algorithms and transformation tools to efficiently solve time series regression, forecasting, and classification tasks. The library includes dedicated time series learning algorithms and transformation methods not readily available in other common libraries.
sktime was designed to interoperate with scikit-learn, easily adapt algorithms for interrelated time series tasks, and build composite models. How? Many time series tasks are related. An algorithm that can solve one task can often be re-used to help solve a related one. This idea is called reduction. For example, a model for time series regression (use a series to predict an output value) can be re-used for a time series forecasting task (the predicted output value is a future value).
Mission statement: “sktime enables understandable and composable machine learning with time series. It provides scikit-learn (https://scikit-learn.org/stable/) compatible algorithms and model composition tools, supported by a clear taxonomy of learning tasks, with instructive documentation and a friendly community.”
sktime is a great example of the user community coming together to produce a understandable, compatible, standards based, open source tool to solve a specific problem. CDRC is proud to support the project through Markus’s involvement and aims to provide similar support to many other projects in the future.