
Uncategorised
Oxford Retail Futures Conference – call for papers
Understanding outcomes of data-driven research in retailing
Background
Retailing is one of the first sectors to have employed large datasets at both strategic and operational levels for a variety of purposes, ranging from frequency marketing, store location, product selection, and supply chain management.
The amount of data generated by internet users, mobile devices, sensors (Internet of Things), organisational and integrative IT systems continues at significantly high levels. A high volume of data, in a variety of formats, can be relatively easily captured and stored.
However, the challenge lies in the extent to which data-driven research and analysis can deliver real insights and outcomes which carry genuine business value, how the results of the analyses will be used, and how data-related tools can improve business performance and competitiveness.
Topic Selection
In this call for papers or extended abstracts (minimum 1 page of A4), we would like to capture the current state of the art in areas related to large data sets and real-time analytics in the retail sector and supply chains, particularly but not exclusively – in relation to spatial data. Submissions may include theoretical and conceptual work, as well as examples from practice, but should focus on outcomes, impact, and/or managerial implications. Results of analysis of large data sets such as those of the ESRC Data Initiative’s Consumer Data Research Centre (https://data.cdrc.ac.uk/) are also welcome.
The call is focused, non-exclusively, on the following topics (applied in the retail context, both at the store-end and in the extended retail value/supply chain):
- Analysing the spatial consequences of changes in customer shopping behaviour
- Behavioural outcomes, including nudging effects
- Changing role of performance measurement in relation to physical space
- Consequences of data-driven analysis for retail business models
- Data-driven changes in organisational practice
- Ethical aspects of data collection & analysis
- Evaluating the impact of new data sources for retail firms
- Impacts of data on the efficiency of corporate decision-making by retailers, suppliers and third party business service firms
- Implications of data-driven research in retailing for public policy
- New methods and tools for analysis of retail data
- Supply chain consequences of emerging retail distribution networks
- The data requirements of omnichannel retailing
Papers submitted will be reviewed by the academic board. Extended abstracts and work in progress are welcome.
Deadlines
- 20th August 2018 – draft abstract/paper submission
- 24th September 2018 – notification of abstract/paper acceptance
- 25th November 2018 – submission of final papers/extended abstracts
Members of the Conference Academic Board
- Dr Richard Cuthbertson, OXIRM, Saïd Business School, University of Oxford, UK
- Dr Jonathan Reynolds, OXIRM, Saïd Business School, University of Oxford, UK
Contact Details
The conference is being organised jointly by the Oxford Institute of Retail Management, Saïd Business School, University of Oxford and the Consumer Data Research Centre (CDRC).
Registration details can be found here.
For enquiries, please contact [email protected].
Registration fee
£195
The fee can be waived for students and presenters. Therefore, please use the dedicated students or presenters registration link.
All other delegates please use this registration link
Opinion: Big Data in Public Health LIDA Seminar
The LIDA seminar, “Big Data in Public Health – future horizons, applications and ethical issues” (13th March), was one of the most well-attended and rigorously engaging we have been to at Leeds so far this year, and if the audience Q&A afterwards was any indication, it seems many others would agree. Dr Michelle Morris (University Academic Fellow in Health Data Analytics, affiliate of the CDRC and Leeds Institute for Data Analytics) began proceedings with a talk which presented the case for using Big Data to fill in the gaps in the narrative for public health research. Then Dr Jon Fistein (Associate Professor in Clinical Informatics, Division of Health Services Research, LIHS) took up the Big Data in public health baton to expertly shine a light on some of the critical legal and ethical questions surrounding data usage for public health research.
Dr Morris opened with a cautionary warning that Big Data is not a “magic pill” which is going to single-handedly solve all of the problems endemic in public health research, nor did she suggest that more ‘traditional’ data like the National Diet and Nutrition Survey or GP questionnaire data be replaced by Big Data. By examining Big Data for public health research through the lens of the current obesity epidemic (simply put, resulting from the imbalance of diet and physical activity), she presented a nuanced reasoning of the ways in which Big Data can help to supply the deficits in public health research created by using exclusively so-called traditional data. For example, she pointed out that in the instance of the National Diet and Nutrition Survey, the data is never going to be as representative as researchers would like due to the limited sample size (6000 people every 6 years), despite great efforts made to recruit a representative sample. She described this data as ‘made’ data where the burden of data generation is on the participants and researchers, and where there is likely to be a bias inherent because the data is being generated for a specific purpose. This contrasts with Big Data which is ‘found’ data, such as transactional data available through supermarket storecards.
The example of Bounts’ physical activity app data, where users elect to share data and the scale of data available is vast, demonstrated the potential of Big Data in public health. Here, the generation of data is intuitive, the data itself arguably more objective because it is captured directly from the source and not biased by recall from a faulty memory, and the burden of generation sits with businesses. Dr Morris’s specific example from 2016 Bounts data also illustrated some of the potential pitfalls in interpreting this kind of Big Data in isolation – i.e. peaks and troughs in activity were deemed to be congruent with changes in British Daylight Saving Time, whereas Bounts suggested other promotional and contractual reasons for the peaks and troughs evident in the data. Expanding on some of the challenges that must be addressed when using Big Data, Dr Morris pointed out that supermarket storecard data can frustrate attempts to isolate the consumer patterns of individuals due to unintentional aggregation – i.e. one household’s shopping captured on one storecard. Nonetheless, the potential of engaging with businesses and consumers which generate Big Data and opening up a dialogue with them about data use were plain and compelling, especially in the age of new Big Data.
By asking the room a series of direct questions designed to make us think about our attitudes to sharing our own data for public health research, Dr Morris succeeded in pointing out that the collection of data and its applications in public health research are issues which affect us all, and about which we are bound to have an opinion. Perhaps the most interesting question was whether the audience felt that Big Data could be used exclusively to populate all of the domains identified on the Obesity System Map:

The feeling in the room was weighted in favour of ‘no’ in response to this question. Dr Morris explained that, whilst Big Data cannot populate all of these specific nodes, it can populate the majority (as per findings [paper forthcoming], from the Obesity Strategic Network, of which Dr Morris is Director). She concluded that, when used in conjunction with existing traditional data, Big Data is a significant contributor in providing answers to questions of great moment in public health research. Finally, with the examples of two PhD projects by Emma Wilkins and Rachel Oldroyd respectively, it was further demonstrated how consumer-generated Big Data can be timelier, include more metadata and more representative than traditional data.
Having heard of the great potential of Big Data in public health, we the audience then enjoyed an exploration of the legal and ethical issues surrounding public health from Dr Fistein, who is trained as a medical doctor and barrister, and currently sits on the Independent Group that Advises NHS Digital on the Release of Data (IGARD). He agreed that there is more potential to link data in the era of Big Data (or new forms of data irrespective of size). By virtue of the fact that Big Data is ‘found not made’, the challenge for public health research ethically and legally speaking is in determining whether new uses of such data is within the expectations of those to whom it relates when they originally ‘provided’ it.
After outlining some of the broad issues of privacy and consent in the digital age, Dr Fistein invited the audience to give their opinion on whether public health research is in the ‘public interest’ which would provide a legal gateway for the use of data for public health. The response was tentative at first with people wondering if this was a question designed to catch them out, but there was general agreement that is was. Dr Fistein pointed out that, unfortunately, many legal definitions of ‘Public Interest’ do not include public health. He observed that there is therefore a tension between the legal position and that of public health practitioners, many of whom argue that public health activities generally are in the public interest, and this should enable data to be used. An example of such uses is illustrated by the Learning Healthcare System in the following PDF.
The Learning Healthcare System
He noted that one proposed solution to the issue of using data for public health is to anonymise it (as this could potentially make the data use lawful). However, he pointed out that there are several issues that render this approach problematic. One issue is data quality, as it may be impossible to reliably link datasets together when ‘anonymised’ or it may be necessary to use identifiable data to ensure reliable linkage. He also described the challenges related to the sense of ownership individuals feel towards data which is generated about them. Citing the well-known example of the catholic woman who uses a contraceptive pill in order to treat a health issue unrelated to contraception (from Pattinson, S., Medical Law and Ethics, Sweet and Maxwell), he pointed out she might be aggrieved were she later to learn that data about her usage of that pill were being used in a study on how to improve contraceptive treatments. He related this to the concept of ‘context collapse’ (as described by the Wellcome Trust) – when the patient receives care in one explicit context and then finds that data about them is being used for another purpose which has not been made explicit. In respect of this, Dr Fistein reminded everyone of Dame Fiona Caldicott’s principle that: “There should be no surprises in data use.” Dame Fiona also said in the 2017 National Data Guardian Report, “the most praiseworthy attempts at innovation falter if they lose public trust.”
Taking this further, Dr Fistein concluded by saying that trust is meaningless without a notion of ‘trustworthiness’ (Onora O’Neill https://www.youtube.com/watch?v=XWwTYy9k5nc) and that public health researchers have an obligation to demonstrate trustworthiness, for example by being transparent about the work they are doing and its benefits. On a practical note, he pointed out that as a bare minimum, public health practitioners and researchers should also know the law and be able to defend their position in relation to it. He recommended that they should consult experts early when they are considering data use, in order to anticipate and address any potential ethical or legal issues.
The two presentations were followed by an animated Q&A session with many of the audience members (a significant number of whom were public health registrars) remarking on how engaging they’d found the speakers and the subjects.
Changing Broadband Speeds in the UK
The CDRC’s Broadband Speed map has proved to be one of our most popular interactive maps to date. In his blog post below, our Research Associate Oliver O’Brien details the nuances behind the map and also highlights key changes between 2016 and 2017.
Broadband Speed – by Oliver O’Brien
The Broadband Speed map is based on data from Ofcom, the UK’s digital connectivity and broadcast media regulator, and I was invited to talk at their Innovation Workshop event, hosted by ODI Leeds, earlier this month. My brief was to demonstrate the Broadband map but also critique Ofcom’s open data offering (which provided the data for the map).
As part of the preparation for the event, I produced a new version of the Broadband map, showing 2017 data from the Connected Nation report (the original was based on the 2016 data). This gave the opportunity to therefore prepare a third map, showing the change between 2016 and 2017. Note that this is showing the change in the average broadband download speed experienced across both business and residential premises connections, averaged by postcode with each postcode averaged then averaged again across the local output area (which typically contains five postcodes for residential areas, but many more than this for business areas.) The metric population numbers displayed when you mouse across each area, therefore, is the number of business and residential connections – typically 50-150 for the latter.
The map shows a general light green gradient across the country, showing broadband connection speeds are gradually increasing, as more and more fibre to the cabinet (FTTC) is installed and people change organically contracts to providers with better service. The places where other colours appear are the interesting results. Large increases are seen in rural Lancashire, near Kendal in the Lake District, as a community-driven ultra-high-speed rural service there continues to roll out. More dramatic improvements are seen just to the east of Cheltenham, again a rural area with specialist high technology and defensive industries.
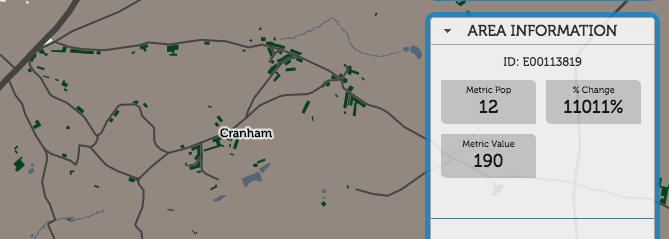
Cranham, for example, has seen a 11000% improvement, from 1.7mbit/s to 190mbit/s, as new business connections have come online:
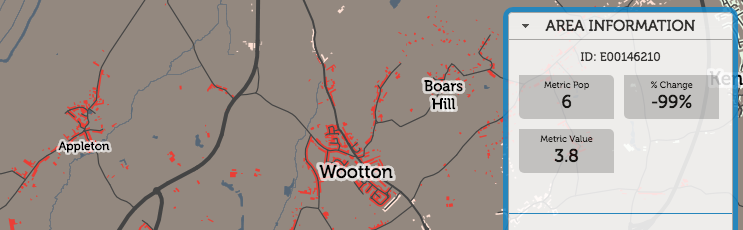
Appleton, on the other hand, has seen a 99% decrease, from 540mbit/s to 2.3mbit/s:
In London, the drop around King’s Cross, the previous year’s fastest postcode, is almost certainly not due to a general decrease in available speed, but actually because residential connections have come online, and demonstrates the problem with aggregating by the residentially defined “Output Area” geography. The previous, ultrafast result was likely due to dedicated ultra-high-speed links into Google’s new UK office, and other high-technology businesses opening there. Since then, the residential blocks nearby have opened. These still have pretty nice connections, but not the business-level infrastructure needed. So, it shows as an average fall in London.
Rotherhithe is always an interesting area:
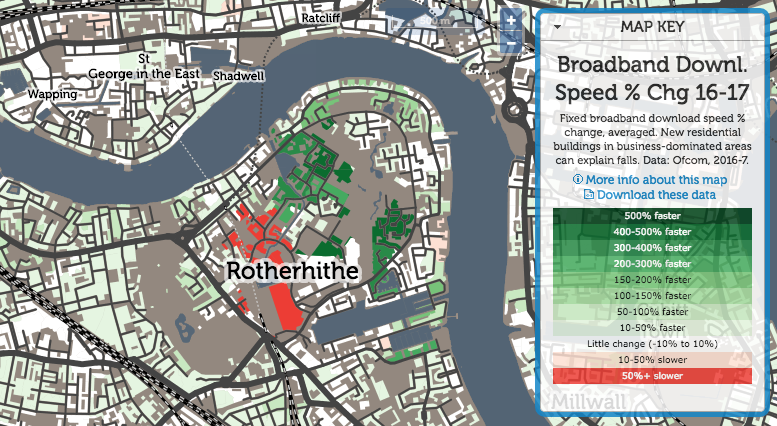
A traditionally very poorly connected area, both in transport but also digital connectivity, it has seen dramatic improvements in many areas. but also big falls in the newest area – again possibly due to an increased residential component in the mix.
Explore the broadband difference interactive map.
Browse Oliver’s Innovation Workshop presentation.
*This blog post has been re-published from http://oobrien.com/.
CDRC host the Annual Roger Tomlinson Prize Lecture
The Consumer Data Research Centre (CDRC) hosted the Annual Roger Tomlinson Prize Lecture at Senate House, University College London (UCL) on 22 March 2018.
Dr Mike Gould, Esri’s Global Education Manager, delivered an engaging talk on ‘Data, Software, and Services: Views from Industry and Academia’ where he threw open the debate on Geographic Information Systems (GIS) and it’s use across a range of services.
During the event Mike Gould presented the annual Roger Tomlinson Prize, which was established at UCL by the founder of ESRI, Jack Dangermond, and has become an inherent feature of the Roger Tomlinson lecture. This year’s prize was awarded to Guy Lansley, Research Associate with the CDRC; an additional prize was presented to Abhinav Mehrotra, Research Associate at UCL.
The event had an excellent turnout of people from across academia, business and retail sectors. A number of attendees took to social media to share their pleasure at being able to view the original hard copy of Roger Tomlinson’s PhD thesis, submitted in July 1974, with one attendee coining it the “first book of GIS”.


The CDRC causal inference summer school is back!
Applications are now open for the much-anticipated Consumer Data Research Centre (CDRC) summer school Causal Inference with Observational Data: challenges and pitfalls (9th-13th July 2018). The school ran in 2017 to huge acclaim from participants, and returns this year with even more content and teaching as it is now a 5 day as opposed to 4 day school.
Taking place at the Leeds Institute for Data Analytics (LIDA), the summer school comprises state-of-the-art training in the analysis of observational data for causal inference. By exploring the philosophy and utility of directed acyclic graphs (DAGs), participants will learn to recognise and avoid a range of common pitfalls in the analysis of complex causal relationships, including the longitudinal analyses of change, mediation, nonlinearity and statistical interaction.
Specifically, the course will cover the following:
- Prediction vs causal inference
- Advanced use of directed acyclic graphs (DAGs);
- The role and relevance of covariates in multiple regression;
- Collider bias in sample selection (including reversal paradox and the Table 2 Fallacy)
- Conditioning on the outcome (including regression to the mean);
- Compositional data errors (including mathematical coupling and composite variable bias)
- Analysis of change and statistical evaluation of longitudinal data
- Statistical interaction and model parameterisation issues.
- Time-varying exposures, time-varying confounding, and G-methods
The key aim of the summer school is to introduce the thinking into statistical modelling of observational data, and to debunk some common misconceptions around causal inference using DAGs, and to teach participants how to avoid the common pitfalls of using observational data. Although the training is delivered by three professionals from the School of Medicine, Prof Mark Gilthorpe, Dr Peter Tennant and Dr George Ellison, applications are not limited to those with a research background in health or medical sciences but are open to all social science disciplines.
Last year’s participants gave glowing feedback on the course, saying that it was well structured, and a game-changer in terms of their thought-processes when they approach their research now. Below are some of the comments following the 2017 summer school:
“The course was a paradigm shift for me in terms of thinking around causal inference and gave me the tools to think about some important pitfalls in analysis that I would have otherwise missed.”
“I found the discussion of how to construct DAGs and the different causes of bias (e.g. regression to the mean, numerical coupling etc.) the most interesting.”
“It was great to think about my own research in a different, more critical way.”
“The tutors were all extremely knowledgeable, approachable, and oozed enthusiasm for the subject!”
“I would not have had any formal training in causal analysis if it were not for this course, it has made me aware of many issues which I will now be alerted to.”
“Now I’ll think more causally about my analysis and hypotheses, and will definitely use things like DAGs to clarify my thinking and analysis strategy.”
Fees and how you can apply
Full details of the summer school can be found here.
Fees are as follows:
£295 (postgraduate students)*
£595 (researchers, academics, public and charitable sector)*
Places for the summer school are limited to 25 so that tutors have good contact time with each participant. These places are expected to fill fast, so apply now using this application form to avoid disappointment. Your application will be reviewed within 1 week and, if you are successful, we will then send you a booking link to pay for your place.
*Fees include tuition, refreshments and lunch for the 5 days; accommodation, breakfast and travel are not included.
Tableau Workshop: opinion from Dr Phani Kumar Chintakayala
After the 22nd February Tableau Workshop, hosted by the CDRC at Leeds, we invited Dr Phani Kumar Chintakayala to share his perspective on the training and Tableau version 10.3 …
“It was back in 2015 that I first heard about Tableau visualization software – it was version 9.0 at this point, and I tried out bits and pieces but didn’t explore much further. Then in February 2018, I attended a 1-day workshop on Tableau 10.3 hosted by the Consumer Data Research Centre (CDRC) in the Leeds Institute for Data Analytics (LIDA). Even before the start of the workshop, as soon as I opened the software, I realised that the latest version of Tableau has come a long way and is far superior to the version I tried back in 2015.
The workshop started off with a couple of introductory sessions, the first of which was delivered by Prof. Roy Ruddle of the School of Computing, who is perhaps best known for his research into novel interactive visualization techniques. He highlighted how visualization can act as a tool to better understand data, especially in the current era of Big Data. The second session was delivered by representatives from Tableau, Thierry Driver and Archana Ganeshalingam, who demonstrated and took us through some examples of how Tableau is used by a range of people from researchers to professionals, for visualizing interesting inputs/outputs.
After the introductory session we were let loose on Tableau 10.3 to gain hands-on experience with its various features. It was quickly apparent how easy it is to use Tableau. We were given around eight, carefully-tailored challenges to complete, using real open data in conjunction with Tableau. Each challenge built on the last and we were required to use a range of different Tableau features, putting into practice our training gained in the morning session. Taken together, these challenges really helped us get to know the various tools and features of the software.
As with many other latest software versions, data-loading in Tableau is as easy as simple drag and drop. Tableau supports basic analytics and provides various means of visualizing data. Some features of the software are very versatile and feel unique: for example its ‘dashboard’ feature which allows users to bring a number of plots (generated using the same data) into one window and enables you to link them in the window. This means you can gain better insight into how a change in one aspect will affect the others.
While doing sentiment analysis on a sensitive topic using Twitter data, I used Tableau to visualize origin of tweets on the issue. I plotted the data on Tableau Map with the size of the blob representing the volume of tweets originating from a city or town. Below is the amateur map that I managed to develop. Through visualization in Tableau, I was pleased to find I could easily identify the cities that reacted on the issue and the volume of tweets generated – much better and more impactful than presenting the same information in, for example, a table.

All in all, the CDRC Tableau Workshop was very useful as it introduced several features of Tableau that will allow me to visualize data in order to better understand it and its implications before proceeding to analyse it. This is a very useful tool, especially when dealing with Big Data/secondary data where understanding the data and their context is very important. Although I have not tried any other visualization software, I believe Tableau is a helpful tool for any analyst wanting to visualize data and thereby gain a better understanding of data and their context.”
Dr Phani Kumar Chintakayala is Senior Research Fellow in the Business School and Leeds Institute for Data Analytics at the University of Leeds. His primary research interest is Behavioural Economics covering consumer behaviour, econometric modelling, sustainability etc.
We are planning to run this workshop again in Spring 2019. Please register your interest for this course by emailing Kylie Norman.
SmartStreetSensor Footfall Atlas explained
We recently launched our SmartStreetSensor Footfall Atlas dataset and it has proved extremely popular. Read on to find out why.
The Footfall Atlas is a derived product based on the Consumer Data Research Centre (CDRC)-Local Data Company (LDC) SmartStreetSensor Footfall Data. It contains information about every sensor installed by the LDC across the UK since July 2015 until December 2017 along with relevant metadata for the network of sensors.
This unique dataset provides a detailed insight into the flows of people around many different types of retail locations by the hour and – unlike the Google popular times feature – these data contain actual quantities in the y-axis.
With these data users can draw from different fields and produce a wide variety of products, such as retail areas classification, comparisons of different footfall signals across different seasons (summer, winter), different types of retailers (restaurants, charities, mobile shops) and even different types of footfall at various points during the day (morning rush hour, lunch hour, night economy).
For detailed information about the CDRC-LDC SmartStreetSensor project, click here.
The SmartStreetSensor Footfall Atlas dataset can be located here.
For more information on how to apply to access this dataset for use in your own research go to ‘using our data services‘.
We launched the SmartStreetSensor Footfall Atlas dataset via the CDRC newsletter. To subscribe, email [email protected].
Leeds Digital Festival 2018
The Leeds Digital Festival is a multi-venue, city-wide festival celebrating digital culture in all its forms, and the CDRC are pleased to be a part of it once again this year. We will be a hosting a number of events throughout the two weeks (16-27 April), including the following training courses:
Introduction to R – 16th April, 13.00-16.00
R is an increasingly popular open source programming language and can be used in many different ways to manipulate and tidy data. In this half-day course provided by the Consumer Data Research Centre (CDRC) in Leeds, you will have the opportunity to work within the R ‘ecosystem’ to import, clean, manipulate and visualize real world data. No prior experience with R required.
Building Simple Smartphone Apps Without Coding (same course running on 19th and 23rd April), 9.00-12.30
Ever wanted to learn more about how mobile applications can be built? Do you have questions about how mobile apps can gather the data you need? Hosted by the Consumer Data Research Centre, this course presented by Dr Chris Birchall from University of Leeds School of Media & Communication, will take an introductory look at some of the alternative routes that exist to create mobile content without pre-existing coding skills. Participants will be able to experiment with ways to create the mobile functionality that they need, working with Software such as MIT AppInventor and tools, such as PhoneGap. No prior experience in digital creation is necessary.
R for Transport Applications: Handling Big Data in a Spatial World – 26-27 April
Delivered by Dr Robin Lovelace of the Leeds Institute for Transport Studies, this 2 day course teaches two skill-sets that are fundamental in modern transport research: programming and data analytics, with a focus on spatial data. Combining these enables powerful transport planning and analysis workflows for tackling a wide range of problems, including: how to effectively handle large transport datasets and where to locate new transport infrastructure. The first day will focus on how the R language works, general concepts in efficient R programming, and spatial and non-spatial data classes in R; the second day will cover its application to geographical transport datasets.
It’s not just us though, CDRC friends and partners across the city are hosting a range of events which may also be of interest to you:
ODI Leeds – the team at ODI Leeds will be starting the week with the ODI Leeds Showcase, hosting their data science training and will be ending the festival with the ODI Leeds Open House. You can find out more about their full programme of events on the ODI Leeds website.
KX Systems – How data & AI are enabling the real-time retail revolution
Trinity McQueen – Research in the tech/digital space and Measuring & defining consumer trust in a changing digital landscape
‘Tidying’ up Brexit and Trump
2016 was an eventful year. The narrow votes in favour of Brexit in the UK and Trump in the US were a shock to many. You’ve probably heard commentators remark on the underlying causes for why people voted as they did. A familiar caricature is of blue collar disaffection (Leave and Trump) versus liberal, metropolitan values and relative affluence (Remain and Clinton). But is this true of the entirety of the UK and US?
The CDRC is pleased to launch a new training short course at Leeds this year, “Explaining Brexit and Trump with Tidy data graphics”, to tantalise the analytical imaginations of researchers interested in using data to examine the influences on human decision-making within the social sciences. Taking place on the 2nd May, this course will be delivered by Dr Roger Beecham, who will lead an exploration of the story told by the data behind the EU referendum vote and American presidential election. You’ll learn how to develop a family of data graphics (in R), each of which will reveal a bit more of the data puzzle behind the UK referendum and US election results.
A lot of theories have been ventured in popular media as to why both votes went the way they did – some ‘clickbait’, others more intriguing – but in this 1 day course you’ll have the opportunity to explore the hard data behind the votes; to look at these data in the specific contexts of socio-demographic variables; and to evaluate area-level variation in the votes. It is a course designed to elucidate and lead you toward more data-grounded answers to the questions of what happened in 2016 and why people voted the way they did.
In addition to understanding a little more about the political phenomena, you will:
- learn how to data wrangle, reshape and curate Tidy data in R
- appreciate some key principles of good data visualization design
- confidently generate data graphics using a consistent vocabulary (ggplot2)
- develop an intuitive understanding of statistical modelling procedures
Sound like fun? You can find out more and book on the course here.
Want to take part in a Data Challenge on the subject of Brexit? The CDRC is currently challenging those planning to attend the GISRUK 2018 conference to use CDRC datasets to submit responses to the theory launched in The Economist article, “The immigration paradox Explaining the Brexit vote” – find out more here.