Thinking of applying to our 2023 Masters Dissertation Scheme (MDS)?
Ten years ago, the Economic and Social Research Council funded a nationwide collaborative Masters Dissertation Scheme for the first time. Over the years, businesses, government and third sector organisations have collaborated with universities throughout the UK to allow Masters students to develop practical solutions to problems through applied research, often using their own sources of data that are not usually available for student projects. Sponsoring organisations solve problems, students get real world problem-solving experience, and many students have gone on to work for the organisations that sponsored their research projects. This year’s projects can be viewed here. As in previous years, there is likely to be very considerable interest in these projects, so interested students are advised to apply as soon as possible!
CDRC data used to understand population displacement from gentrified London council estates with surprising results
New research using our novel Linked Consumer Registers has found that the demolition and associated redevelopment of council estates in London has displaced former residents, potentially separating them from their existing employment, education and care networks. Yet around 85% of the displaced in remain London, and most stay within the same Borough. This suggests that the scale of displacement may be less than has previously been suggested, particularly in the popular press. However, there is also evidence of increasing numbers of moves out of London to the Southeast and East of England.
The full paper in published in Environment and Planning A, authored by Jon Reades, Loretta Lees, and Phil Hubbard.
AHAH is a multi-dimensional index for Great Britain measuring how “healthy” neighbourhoods are based on the locations of services that are ‘assets’ or ‘hazards’ for health in each area.
AHAH is calculated based on data from 15 indicators divided into four domains:
Health services – GPs, hospitals, pharmacies, dentists, leisure services
Air quality – air pollution levels for Nitrogen Dioxide, Sulphur Dioxide and Particulate Matter (PM10)
Natural environment – green spaces and blue spaces
The resource allows researchers and policy makers to understand which areas have poor environments for health and helps to move away from treating features of the environment in isolation to provide a comprehensive measure of neighbourhood quality.
AHAH is produced for Lower Super Output Areas for England and Wales, and Data Zones for Scotland. Component inputs for this index use data that is the most up-to-date as of March 2022.
All of the individual indicators to AHAH have also been made freely available in the data resource in a push for opening up small area health data. As such, it provides one of the most comprehensive free data resource available for such data. You can freely explore how your local area compares on our data at https://mapmaker.cdrc.ac.uk/#/access-healthy-assets-hazards. AHAH and all of the individual indicators are openly available at https://data.cdrc.ac.uk/dataset/access-healthy-assets-hazards-ahah.
Changes from previous versions
The latest version of AHAH includes several methodological and conceptual refinements following extensive public feedback on previous versions.
Most noticeable is the change in how we measure accessibility to green spaces. We received a lot of user feedback, especially from rural communities, who did not feel that measuring distance to nearest accessible park or green space was the best measure since it under-represented rural areas (i.e., farmland that is green but not necessarily accessible).
In response, we have updated the measure to use a satellite derived measure of the total green space (NDVI). We note here the measure is for the resident population and their surrounding contexts.
This has improved the accuracy for measuring access to overall green space. These changes have resulted in changes in the overall AHAH index value, mostly seeing rural areas with good access to green spaces having better overall scores. As a result, we would suggest caution in making comparisons over time between the overall AHAH index.
We have also further updated our statistical approaches to give more accurate accessibility estimates and utilize GPU support for faster processing.
Researchers from CDRC have provided vital data analysis as part of London Borough of Camden’s Future High Streets programme
The aim of the programme is to ‘re-imagine’ high streets for the 21st century and ensure they are the heart of community and economy.
Even before the COVID-19 pandemic, high streets across Britain were facing a multitude of challenges, including:
the ongoing shift away from traditional retail to online shopping
a decline in footfall
higher costs due to rising business rates and commercial rent
The pandemic compounded these issues. National lockdowns closed non-essential stores and changed behaviours in various ways, with fewer commuters visiting central London locations.
In response, Camden Council devised the Camden Future High Streets programme to support its high streets through the pandemic and into a robust recovery and ready to face the future.
Professor James Cheshire, Deputy Director of the Consumer Data Research Centre and his team, collaborating with Camden, performed an extensive search for high street related data and datasets in six main categories: high street boundaries, mobility, economic, retail, social and demographic, and sustainability. They used pre-existing data to show changes over time and differences between high streets in order to inform local policy.
“We’re sort of a data of broker,” explains James. “Part of that role is acquiring data, processing it, and giving it back in a way that people can make good use of. But I also think we can be an impartial advisor on what data is good and what data is less good. We don’t have any real sort of commercial imperative to be selling a particular data product so we can impart an honest view.”
James and his team produced a detailed report, Data for Future High Streets, containing their insights and six recommendations of how data can be better used to improve resilience and vibrancy of high streets.
Abigail Hill, played an important role in the project, with elements of her PhD research included the report and utilised by Camden.
“The knowledge exchange with the London Borough of Camden has enriched my research that focuses on measuring the resilience of British high streets,” she says. “The project provided invaluable insights into high street regeneration projects and decision making, enabling my research to make an impact on local policy.”
Councillor Danny Beales, Cabinet Member for Investing in Communities, Culture, and an Inclusive Economy (Camden Council), comments: “It’s been a productive collaboration. Working with UCL provided valuable insights into how London Borough of Camden can use data, including the data we already hold, more effectively to support the recovery of our high streets after COVID.”
You can read more about the Resilience of British High Streets to the COVID-19 Lockdown Restrictions here.
How can supermarket delivery vehicle routing be optimised?
Supermarkets must transport large quantities of stock from depots to many different stores on a daily basis. It is important to deliver this stock efficiently, in order to minimise both transport costs and carbon emissions. This project aimed to investigate methods to optimise the routing of supermarket delivery vehicles. The project used the most basic delivery strategy, by which only one store is serviced during each trip from the depot, as a benchmark for comparison with the optimised delivery vehicle routing solutions.
Data and methods
The delivery vehicle routing optimisation was implemented using integer programming. The optimisation formulation was applied to a group of 81 stores which are all service by a single depot. For large groups of stores, the number of potential routes which a delivery vehicle can take is prohibitively large to be solved within a reasonable timeframe. Therefore, large groups of stores must be divided into smaller groups, based on location, and the optimisation solved separately for each group. Analysis of group sizes found that the groups of stores should contain 10 stores or fewer. As such, the 81 stores which were investigated were divided into nine groups of nine stores. This allowed the optimisation for all groups of stores to be solved within a relatively short time frame.
Key findings
The delivery vehicle routing problem was optimised for the nine groups of stores with 100 randomised sets of demand. It was found that the optimisation reduced the total required travel distance, when compared with the most basic delivery strategy.
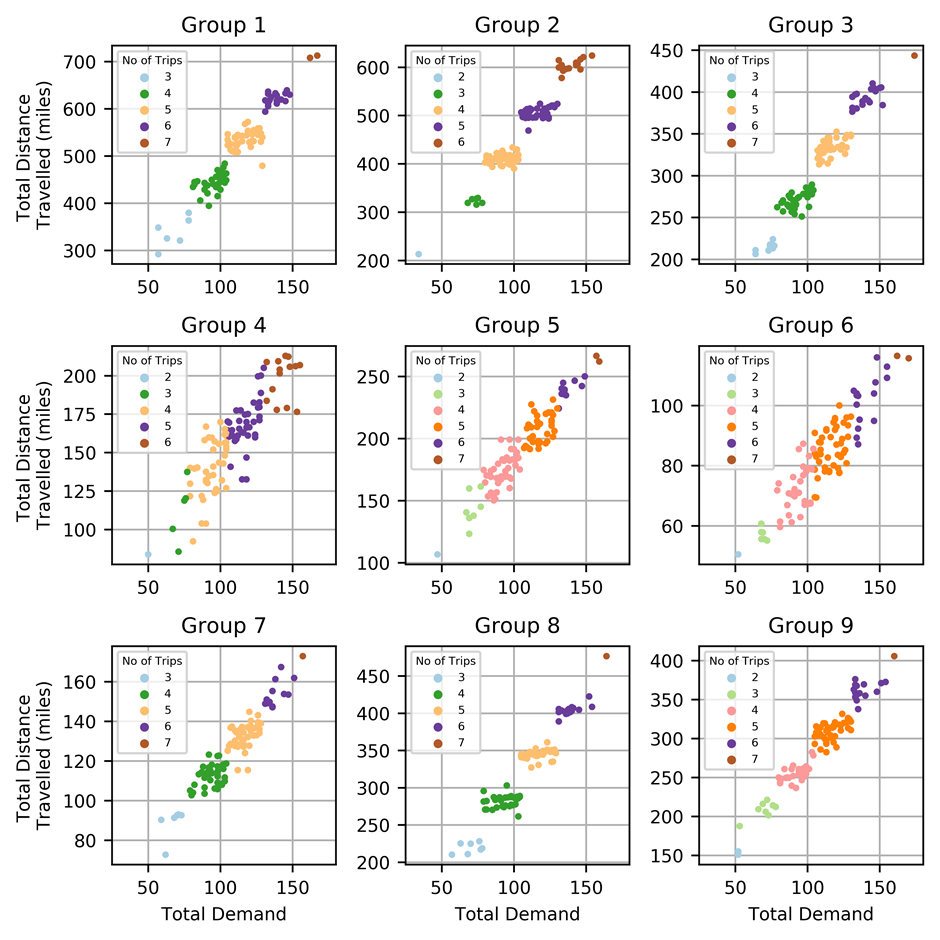
Figure 1 shows the total travel distance required against the total demand for each group of stores, with the data coloured by the total number of trips required for each optimisation solution. For some groups, e.g. Groups 2 and 3, the data appears to be highly clustered, with each cluster representing how many trips were required by each solution. For other groups, e.g. Groups 5 and 6, the data doesn’t appear to be clustered. For groups showing data which is clustered, there is little or no overlap in the total required travel distance between solutions requiring different numbers of trips. Conversely, for groups which do not show clustered data, there is significant overlap in the total travel distance between solutions requiring different numbers of trips.
It was found that groups of stores for which the stores were close to one another, relative to the depot, produced highly clustered data, as each additional trip from the depot and back required by the solution increased the total travel distance by a significant proportion. Whereas, groups for which the stores were not as close to one another, relative to the depot, did not produce clustered data as each additional trip from the depot and back increased the total travel distance by a smaller proportion.
Figure 1. Travel distance vs demand for each group
Value of the research
This project has demonstrated a method to optimise delivery vehicle routing which can reduce the distance travelled by delivery vehicles significantly, when compared with the most basic delivery strategy and provides a valuable proof of concept study. The methods investigated in this project may be developed further by WM Morrisons Supermarkets in order to optimise delivery vehicle routing, which could help to reduce both transport costs and carbon emissions.
Quote from project partner
This 6-month research project provided an interesting and insightful investigation into optimisation approaches for delivery vehicle routing. I found the collaboration with Jacob and the wider project team valuable and would welcome the opportunity to work with LIDA on other projects in the future.
Insights
Optimisation of delivery vehicle routing can reduce transport costs and carbon emissions.
Dividing large groups of stores into multiple, smaller groups allows the optimisation to be solved more efficiently.
Research theme
Urban analytics
Statistical and mathematical methods
People
Jacob van Alwon – Data Scientist, Leeds Institute for Data Analytics.
Jon Ward – Lecturer in Mathematics, University of Leeds.
Areas most at risk of food insecurity in the cost of living crisis identified by CDRC and Which?
In a groundbreaking new study researchers from the Consumer Research Data Centre at the University of Leeds and Which? have identified the places around the UK where households are most at risk in the cost of living crisis and likely to be in need of extra support to access affordable, healthy and sustainable food.
The CDRC team, led by Dr Michelle Morris, and the consumer champion developed the Priority Places for Food Index as part of Which?’s national campaign to urge supermarkets to support consumers through the cost-of-living crisis.
The index uses data across a range of relevant dimensions to rank local areas by the likelihood of the people living there needing support.
The researchers considered factors such as deprivation, poor access to affordable food, having no large supermarkets nearby, a lack of online shopping deliveries or circumstances such as no car access making it difficult to shop around. All of these factors can make it difficult for people to find healthy and affordable food.
Michelle Morris, Associate Professor Nutrition and Lifestyle Analytics, University of Leeds said: “With so many people in the UK already suffering from food insecurity and the cost of living crisis making that much worse, we need to do all that we can to support those most in need to access affordable, healthy and sustainable foods.
Our interactive map makes it easy to identify neighbourhoods most in need of support and highlights the main reasons that they need this support, recognising that one size does not fit all and that tailored help is required.”
“We will be engaging widely with the food industry and policy makers to help them use the tool to help our communities, both nationally and locally. Some of our local communities in Bradford have been identified within the top 20 Priority Places across the UK, which is very worrying.”
Which? – Affordable Food For All
Which? are using the index as part of its newly launched Affordable Food For All campaign, and have created a 10-point plan to help supermarkets provide the support people around the country desperately need in order to feed themselves through the ongoing crisis.
Sue Davies, Which? Head of Food Policy explained: “We know that millions of people are skipping meals through the worst cost of living crisis in decades but our new research tells us where around the UK support is most urgently needed.
The big supermarkets have the ability to take action and make a real difference to communities all around the UK. That’s why we’re calling on them to ensure everyone has easy access to budget food ranges that enable healthy choices, can easily compare the price of products to get the best value and that promotions are targeted at supporting people most in need.”
Priority places across the UK
Analysis of the Index shows that overall, seven in 10 UK Parliamentary constituencies have at least one area in need of urgent help accessing affordable food – but there are 16 constituencies across England and Wales for which at least three-quarters of the constituency are at risk.
Within England there is a large variation in where priority places are located across regions. The region with the greatest frequency of priority places is the North East, although because this is a small region then there are more priority places in Yorkshire and the Humber, the West Midlands and the North West in absolute terms. There are relatively few priority places in London, the South East and the South West, although in the latter there is a concentration in Cornwall.
In Wales, the highest concentration of areas at high risk during the food crisis is in the Valleys where proximity to a large supermarket or access to online deliveries may be very poor. Wales has a higher proportion of rural places where accessing affordable food is an issue than England and Scotland.
In Scotland, the places in highest need of support are in the Central Belt, according to the Which? and CDRC index, but there is also a notable concentration in and around Dundee where there is relatively poor access to online food deliveries and people are more likely to be suffering from fuel poverty and on a low income.
Northern Ireland has the most even geographical spread of areas in need of support accessing affordable food. However, there is a noticeably greater concentration in parts of south-west Belfast and in and around Derry/Londonderry.
The Priority Places for Food Index is a composite index formed of data compiled across seven different dimensions relating to food insecurity for the four nations in the UK. It is constructed using open data to capture complex and multidimensional aspects of food insecurity.
Building on the CDRC e-Food Desert Index (EFDI), but with additional domains relating to fuel poverty and family food support, the goal of the Priority Places for Food Index is to identify neighbourhoods that are most vulnerable to increases in the cost of living and which have a lack of accessibility to affordable, healthy, and sustainable sources of food.
From October 2022, HFSS legislation means new restrictions on product placement for some high fat, salt or sugar products.
Researchers at the Consumer Data Research Centre at the University of Leeds have developed the Nutrient Profile Model (NPM) calculator which makes assessing products easy.
Our free tool calculates the NPM score and helps you identify whether a product is in scope for restrictions, supporting compliance and enforcement.
Victoria Jenneson, lead researcher on the project, explained: “It’s great to see Government taking action to restrict promotions of HFSS products, but the legislation is quite tricky to interpret. Stakeholder consultations revealed a need for support to implement the new rules, particularly for SMEs, convenience stores and enforcement officers. The NPM calculator offers a free to use mobile-friendly tool which makes HFSS assessment simple and transparent.”
CDRC part of collaborative effort to curb Leeds’ food emissions
The CDRC are part of a new collaboration which aims to reduce the city’s carbon footprint through food has been announced by Leeds City Council, the University of Leeds and FoodWise Leeds.
Around 10% of the UK’s carbon emissions can be linked to the food we eat or waste, with every part of the journey from farm to fork contributing to its overall environmental impact.
The partnership of organisations is working collaboratively on a number of new projects designed to tackle climate change by making it easier for residents and organisations to make informed food choices, support more sustainable food production, and reduce food waste.
Studies show that our collective health and the health of the planet would improve if we ate a balanced diet consistent with the NHS-recommended Eatwell guidelines. For some people, this may mean eating more fruit and vegetables and less meat.
CDRC Carbon Calculator
Researchers at the Consumer Data Research Centre (CRDC) based at the University of Leeds have recently developed a new calculator to make it easier for food venues and caterers to estimate the carbon footprint, land use, and water use of meals based on their ingredients.
The council’s school meals provider, Catering Leeds, is already trialling the new tool to review its menus and suppliers to explore how to become more sustainable and support the local authority’s climate targets. Last year, Leeds City Council set out its ambition to halve the carbon footprint of the average meal it serves by 2030.
Engaging the local community
Meanwhile, FoodWise Leeds—a citywide partnership with representatives from third sector, academia, businesses and the council—has used the calculator’s findings to show the impact of simple, nutritious, and affordable recipes published on its new online Recipe Hub. It is believed to be the first recipe hub to include carbon calculation and supports the Partnership’s ambition to encourage greater sharing of cooking skills and knowledge.
As well as developing the carbon calculator, the University of Leeds researchers have also used their research to engage young people in local primary schools through special food data science lessons, workshops, and even creating an interactive and educational ‘Planet Plates’ game.
Each of the organisations in the new partnership, plus many others, have also contributed to the creation of the first city-wide food strategy currently in development. The new Leeds Food Strategy will be published in draft form and will open to consultation later this month.
Councillor Helen Hayden, Executive Member for Infrastructure and Climate at Leeds City Council said:
“The food we eat is responsible for a significant proportion of our carbon footprint, so we believe it is important to lead by example to reduce the impact of the food we serve, whilst empowering others to do the same.
“This new collaboration with the University of Leeds and Food Wise is a brilliant example of how working together can help us realise our ambitions for a healthier and greener city.
“Going forward, we’ll continue to educate and equip organisations and residents with the tools and knowledge they need to make informed food choices, to make it easier for the city to come together to help Leeds tackle climate change through food.”
Alexandra Dalton, a former data scientist at Leeds Institute for Data Analytics (LIDA) and the Consumer Data Research Centre:
“When we buy food, we don’t often think about where it has come from, or the environmental impact of the food supply chain.
“Small changes to our diets, such as eating more fruit, vegetables, and plant-based products make a difference. However, we should also try and consider where certain foods come from, how processed they are, or whether it is in season.
“While working with Leeds primary schools and Leeds City Council, we have created resources that help educate pupils about the impact of their food choices and encourage them to support more sustainable food behaviours.”
“I’m really excited to be building on our existing partnership with the University of Leeds and Leeds City Council with this new collaboration.
“The Leeds Recipe Hub is an innovative resource that will enable community groups and individuals to search, try, and share nutritious, tasty, and affordable recipes—whilst helping people to better understand the environmental impact of their food choices.
Diverse data scientists make for more representative data science
CDRC is a key funder of the LIDA Data Scientist Development Programme (DSDP) which gives early career data scientists the opportunity to use real-world data to solve real-world data challenges. By contributing to projects through funding, data and expertise, CDRC meets its objective of creating highly skilled data scientists with an understanding and ethos for open research, open methods and the current landscape of data science. In a recent case study about the Programme’s award-winning work on building a research culture which promotes Equality, Diversity and Inclusion, CDRC’s Kylie Norman discusses how more representative recruitment in data science leads to more representative data science insights.
Through its three pillars of practice – research innovation, building data science capacity, and sharing data for collaborative research through its Data Service – CDRC is able to support the DSDP, not only through funding projects for social good, but also by providing the in-house and stakeholder expertise to build the essential skills of an early career data scientist. This is owing to CDRC’s shared commitment to building resilience, robust methodologies and their understanding of ways of working in its early career data scientists. During their induction period, each cohort of LIDA data scientists receives valuable contact time with CDRC staff through lectures, seminars and workshops on hard and soft skills ranging from: reproducible coding practises and data management; GIS and spatial analysis for beginners; how to conduct data science for the greatest engagement and impact; how to work with partners; understanding their own ways of working (WoW) and the WoW of those in their teams; and what pitfalls are inherent in the practice of data science; as well as, and perhaps most importantly, how to fail well.
We all want to do good work, but deep down, I believe we also want our work to have meaning and to drive positive change.”
Eric Wanjau Muriithi, LIDA Data Scientist 2021-22
CDRC has seen the benefit of this holistic approach to developing a diversity of data science talent in more representative data insights. For example, Simon Leech, data scientist 2020-21, worked with local authorities and other stakeholders on CDRC Local Data Spaces to determine the optimal locations for COVID-19 testing sites in Liverpool, based on analyses of geodemographic factors affecting susceptibility to the virus.
It has also been able to better visualise and tell the data story of the gaps in provision of government support services to those hit hardest by the cost of living crisis, e.g. in Alex Dalton and Tom Albone’s Free School Meals Uptake blog series. Ifeanyi Chukwu’s work with CDRC’s Nik Lomax on the Impact of COVID-19 on Cancer Referrals, concluded that considering geodemographic contexts “helps to identify the segments of patients who were most vulnerable and thus may require more attention in receiving faster cancer referrals and improved prognosis.” The more representative our data scientists, the more representative the data science.
Three of the Programme’s data scientists working on CDRC research projects, Alex Dalton, Diogo Ann Onuselogu and Rosalind Martin, were nominated for the University’s Engaged for Impact Awards 2022, with two winning in their award categories, and one coming in runner-up position.
In a research culture which asks the question, “but why?”, “who do these census data overlook?”, or “what biases are inherent in these data?”, data insights are bound to be more representative because the data scientists asking those questions often have first-hand experience of falling into the so-called ‘Data Gap’. Read on to find out more about how LIDA is improving diversity and representation in its DSDP, and how CDRC is supporting this work.
Do healthy checkout strategies lead to healthier purchasing behaviour?
Research Team: Alison Fildes, University of Leeds; Phillippa Lally, University College London; Michelle A Morris, University of Leeds; Alexandra Dalton, University of Leeds; Helen Croker, University College London
From Autumn 2022, the rules for selling products high in fat, sugar and salt (HFSS) in England will change and location restrictions will come into force to prevent these items from being shown in front of store, on gondola ends and at checkouts.
As retailers undertake preparations to implement these new regulations, researchers from the Consumer Data Research Centre and colleagues assessed the impact that location restrictions can have on the sale of less healthy foods.
In 2015 the ‘healthy checkouts initiative’ was launched in Tesco Express convenience stores across the UK. The initiative removed less healthy products – those high in fat, salt or sugar – from the in-queue checkout space in 1151 stores.
However despite having been rolled out on a mass-scale, the initiative had not been subjected to external evaluation until now and while lots has changed since 2015, it is important to share these learnings with the wider community.
In a study, published today in the journal Nutrition Bulletin our researchers analysed sales data for 1101 participating Tesco Express stores over an eight-week period in 2014, prior to the introduction of the initiative, and the same eight-week period in 2015 following the roll-out.
Analysis revealed that whilst shoppers mean overall spend increased from 2014-2015 the proportion of less healthy food decreased, from 8.21% in 2014 to 8.03% in 2015. Unsurprisingly confectionery accounted for the largest proportion of less healthy product spend and showed the biggest reduction, from 4.12% in 2014 to 3.91% in 2015.
The team used data from other major UK stores to compare Tesco’s sales to the UK market and found there was no general decline in sales of less healthy products (with the possible exception of crisps) in the UK market during the period, whereas sales from Tesco only showed a slight decrease in sales.
Co-author of the report, Dr Michelle Morris, from the Nutrition and Lifestyle Analytics Team at the University of Leeds, said: “Tesco was one of the first supermarkets to implement a healthy checkout strategy and our analysis indicates that the removal of less healthy products from checkouts can lead to small but important changes with respect to healthier purchasing behaviour. However, the study also highlighted some of the challenges that retailers face when implementing such initiatives.”
Oonagh Turnbull, Head of Health and Sustainable Diets At Tesco, said: “We are committed to helping our customers enjoy a better-balanced diet and to making Tesco the easiest place to shop for affordable, healthy, sustainable food. We have a long history of taking action, from being the first supermarket to take sweets off our checkouts in large stores in 1994 to ensuring all our Own Brand soft drinks were below the Soft Drinks Sugar Levy in 2016 – ahead of its introduction.
Helping our customers to eat a healthier and more sustainable diet is a key focus for our business. In March 2021, we set out our ambitious health commitments including an increase in sales of healthy products, as a proportion of total sales, to 65% by 2025. More recently, following the Government announcement that restrictions on multibuy deals on foods high in fat, salt or sugar (HFSS) are to be delayed for a year, we also confirmed that we will continue with plans to remove volume-led promotions on HFSS products from October 2022.