Supermarkets must transport large quantities of stock from depots to many different stores on a daily basis. It is important to deliver this stock efficiently, in order to minimise both transport costs and carbon emissions. This project aimed to investigate methods to optimise the routing of supermarket delivery vehicles. The project used the most basic delivery strategy, by which only one store is serviced during each trip from the depot, as a benchmark for comparison with the optimised delivery vehicle routing solutions.
Data and methods
The delivery vehicle routing optimisation was implemented using integer programming. The optimisation formulation was applied to a group of 81 stores which are all service by a single depot. For large groups of stores, the number of potential routes which a delivery vehicle can take is prohibitively large to be solved within a reasonable timeframe. Therefore, large groups of stores must be divided into smaller groups, based on location, and the optimisation solved separately for each group. Analysis of group sizes found that the groups of stores should contain 10 stores or fewer. As such, the 81 stores which were investigated were divided into nine groups of nine stores. This allowed the optimisation for all groups of stores to be solved within a relatively short time frame.
Key findings
The delivery vehicle routing problem was optimised for the nine groups of stores with 100 randomised sets of demand. It was found that the optimisation reduced the total required travel distance, when compared with the most basic delivery strategy.
Figure 1 shows the total travel distance required against the total demand for each group of stores, with the data coloured by the total number of trips required for each optimisation solution. For some groups, e.g. Groups 2 and 3, the data appears to be highly clustered, with each cluster representing how many trips were required by each solution. For other groups, e.g. Groups 5 and 6, the data doesn’t appear to be clustered. For groups showing data which is clustered, there is little or no overlap in the total required travel distance between solutions requiring different numbers of trips. Conversely, for groups which do not show clustered data, there is significant overlap in the total travel distance between solutions requiring different numbers of trips.
It was found that groups of stores for which the stores were close to one another, relative to the depot, produced highly clustered data, as each additional trip from the depot and back required by the solution increased the total travel distance by a significant proportion. Whereas, groups for which the stores were not as close to one another, relative to the depot, did not produce clustered data as each additional trip from the depot and back increased the total travel distance by a smaller proportion.
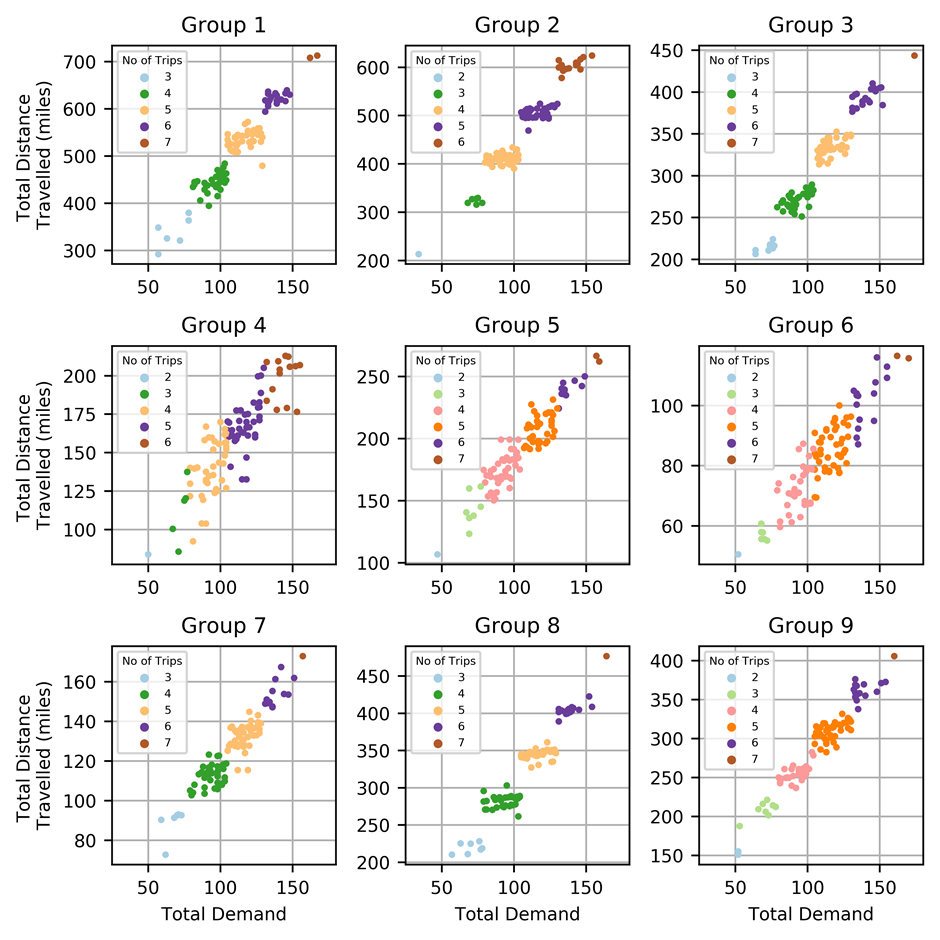
Figure 1. Travel distance vs demand for each group
Value of the research
This project has demonstrated a method to optimise delivery vehicle routing which can reduce the distance travelled by delivery vehicles significantly, when compared with the most basic delivery strategy and provides a valuable proof of concept study. The methods investigated in this project may be developed further by WM Morrisons Supermarkets in order to optimise delivery vehicle routing, which could help to reduce both transport costs and carbon emissions.
Quote from project partner
This 6-month research project provided an interesting and insightful investigation into optimisation approaches for delivery vehicle routing. I found the collaboration with Jacob and the wider project team valuable and would welcome the opportunity to work with LIDA on other projects in the future.
Insights
- Optimisation of delivery vehicle routing can reduce transport costs and carbon emissions.
- Dividing large groups of stores into multiple, smaller groups allows the optimisation to be solved more efficiently.
Research theme
- Urban analytics
- Statistical and mathematical methods
People
Jacob van Alwon – Data Scientist, Leeds Institute for Data Analytics.
Jon Ward – Lecturer in Mathematics, University of Leeds.
Partners
WM Morrisons Supermarkets
Funders
The CDRC funded this project as part of our ongoing commitment to the LIDA Data Scientist Development Programme.