Understanding speed behaviours, speed limit compliance, and road characteristics in Leeds
Research by Long Chen and Ed Manley uses data provided by Compass IoT to provide an overview of speed behaviours, speed limit compliance and road characteristics in Leeds.
Introduction
Importance of Speed behaviours
Speed behaviours of vehicles are important facets in transport planning, road safety and urban livability. There are also several critical social and environmental aspects linked with speed behaviors, e.g., excessive carbon emissions.
Speed limit compliance
Adherence on posted road speed limits would have positive effects on traffic safety, road capacity, and traffic congestion, etc.
Measures of speed behaviours
Prior studies are often conducted by questionnaire survey; limited sites observation; and simulated driving environment to capture vehicle speeds and driver’s speed behaviours.
Study Data
For this study we used vehicle trajectories with travel speeds and acceleration indicators, provided by Compass IoT. This dataset is available for access on the CDRC data repository. The dataset is available for several UK cities. The data used in this study focuses on Leeds only, and contains 3,008,530 individual point records within 44,321 unique journeys, during October 2023.
The Gaps
• There is an absence of studies capturing speed behaviours and characteristics for large volume of vehicle trajectories on a larger geographical scale.
• There is a lack of knowledge between speed behaviours, road characteristics and urban environment at finer-granularity.
Methods
• Measures of speed selection (including adherence with speed limit) and acceleration behaviours (e.g. slow / rapid) extracted
• Mean measures computed over time (hour, day) and by road segment
• Quantiles used to select boundaries for assessing acceleration and deceleration behaviours, including extreme behaviours (Q1, Q4)
Results
Speed behaviours over time
Temporal variation of speed, acceleration, deceleration in Leeds show that fastest speeds occur during the night-time; Rapid acceleration and deceleration events are more common during the daytime than at night
Figure 1: Temporal variation of speed by quartiles, Figure 2: Temporal variation of Acceleration, Deceleration by quartiles
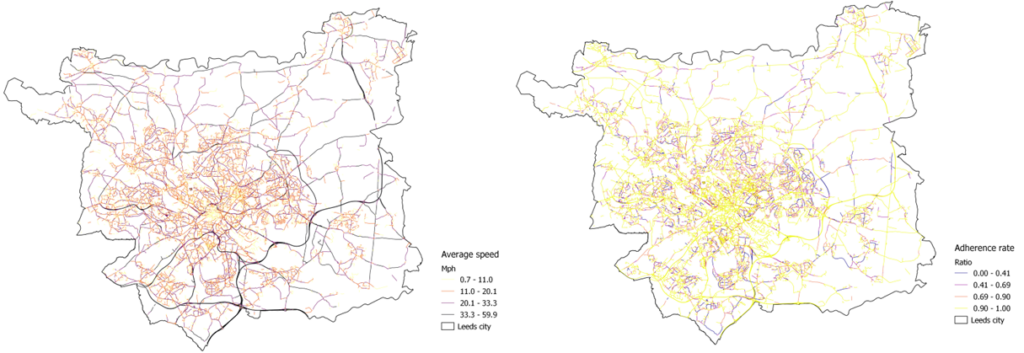
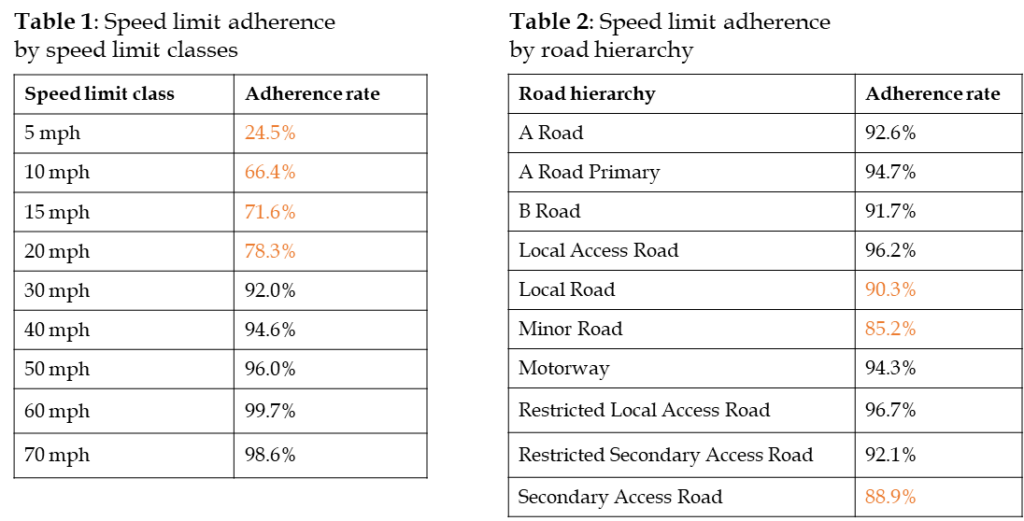
Speed selection and adherence over space
Lower speeds observed in. dense road networks and urban areas; Higher speeds observed on highways and major roads.
Figure 3: Average speed at Road segments Figure 4: Adherence rate at Road segments
Better adherence in dense road networks, and urban areas; Worse adherence on 20mph zones and pedestrianised areas
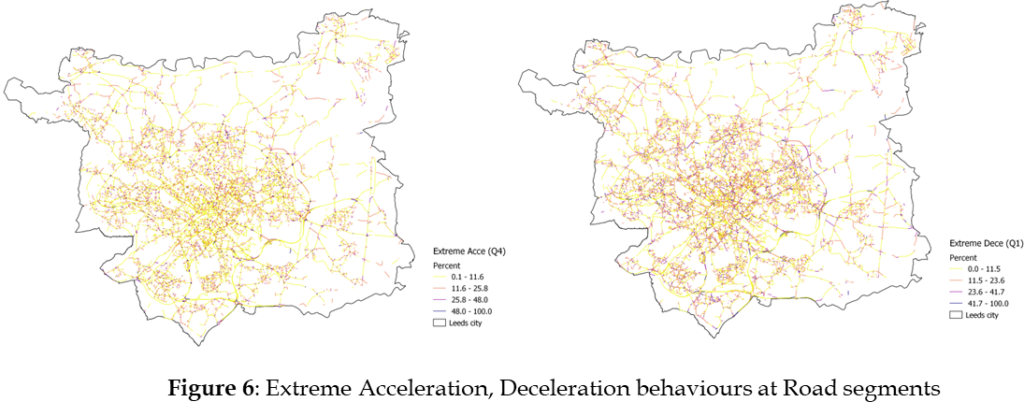
Acceleration, and Deceleration
Average acceleration, deceleration maps illustrate that higher acceleration and deceleration road segments are located at main roads, particularly around junctions, and suburban residential areas
Roads segments with extreme acceleration, and deceleration behaviours usually accommodate in dense road network, and junctions of road networks.
Conclusion
• Results show distinctive speed limit adherence, acceleration, and deceleration characteristics in road hierarchy and urban areas, highlighting the potential for analysing speed behaviours in urban settings.
• Specifically, lower speed limit adherence behaviours generally occur in roads with lower speed limit, and minor and local roads, in suburban residential areas; Extreme acceleration and deceleration behaviours are found in dense road network, and entries and exits of major roads (e.g. motorways).
• The exploration of speed behaviours opens up new opportunities for considering urban mobility and design, and opportunities for understanding the latent mechanisms and factors influencing these behaviours.
A recent study from Dr Stephen Clark explores the change in price of limited-edition Banksy prints over the last decade – we asked him to share his thoughts on whether there was a Banksy price bubble during COVID 19.
Here at the CDRC we work with industry partners to make consumer related data available to trusted researchers, whose work can help us to understand important social challenges. In this piece here we are looking at a particularly niche consumer and their behaviour during an extra-ordinary period in recent history.
The consumers are those who purchased limited edition prints at auction by the street artist Banksy, and the time period is during the global COVID-19 pandemic. In particular, did a pricing bubble occur for his works during this period?
BANKSY | TROLLEYS, non-commercial use https://pestcontroloffice.com/use.asp
Why Banksy?
Banksy is probably the world’s most famous street artist. His true identity is unknown but it is believed that he started his street work during the early 90’s in the English city of Bristol.
BANKSY | STOP AND SEARCH, non-commercial use https://pestcontroloffice.com/use.asp
He is best known for his satirical humour and takes on modern life, mixing together commercial, political and contemporary images to provide social commentary.
His works consist of one-off originals and, in the late 90’s and early 2000’s, he started to produce a limited number of screen prints in signed and unsigned editions. These were eagerly purchased, initially by an enthusiast class of customer, but, as his popularity and value increased, latterly by an investor class. On the primary market these prints would initially sell for less than £500.
The data – Banksy Auction Results
In this study use is made of the database of Banksy auction results maintained by the www.banksy-value.com web site. This web site has catalogued the details of Banksy works sold at auction houses all over the worlds since the mid 90’s.
The limited edition prints in this database are used to examine what features of a print influence the selling price, and to what extent these prices may have been affected by the COVID-19 pandemic
The impact of COVID-19 on the sales prices of Banksy limited edition art works
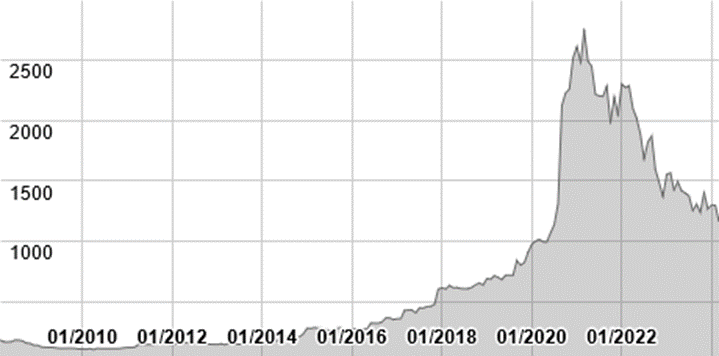
The www.banksy-value.com web site maintains a tracker index for the sales prices of Banksy limited edition art works and this begins to show the impact and the extent of COVID-19 on his market.
From this chart it is clear that there was a steep rise in the sales price of Banksy prints starting in early to mid-2020, and that in recent months the prices have dropped considerably to back where they were at the start of the pandemic.
But does this meet a definition of a bubble? A bubble in asset classes, such as stocks and shares, housing, crypto-currencies and even tulips, is composed of many stages: Expectation; Boom; Euphoria; Profit-taking and Panic.
The start of the COVID-19 pandemic was an unprecedented time in recent history. Many people were unsure of their futures, both health wise and economically.
This uncertainty could have gone two ways in the Banksy art market, either people would be desperate to sell his works to get cash for daily expenses and his prices would crash, or they could seek out opportunities to invest for the future and look to Banksy works to provide a safe – and accruing – haven for any savings or credit. Clearly from this figure it was the latter case.
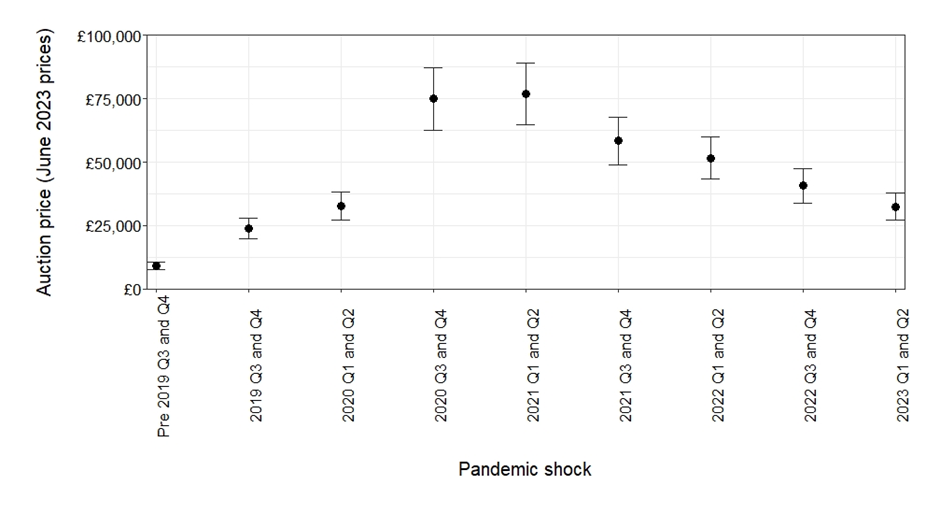
In the hedonic regression model for Banksy prints, a number of factors were controlled for before examining the impact of COVID-19. These included the particular image, if the print was signed by Banksy, the condition of the print, and the size of the edition. The reputation of the auction house and the location of the sale were also used along with a linear time trend. To capture the impact of COVID-19 a series of eight half year 0/1 variables were used to measure this impact and by using a random effects model, the impact was allowed to vary by the image. This would allow an assessment of whether the price of some images were impacted by COVID-19 more than others.
Banksy | Game Changer, non-commercial use https://pestcontroloffice.com/use.asp
Firstly the extent of the COVID-19 shock is shown in this chart. In the years prior to the second half of 2019, the long run cost of a Banksy print at auction was about £10k, but by the end of 2019 the price was more in the region of £25k. These prices quickly rose, by the end of 2020 tripping to around £75k within a year. Such prices were not sustained however, and starting in the second half of 2021 the prices began to fall.
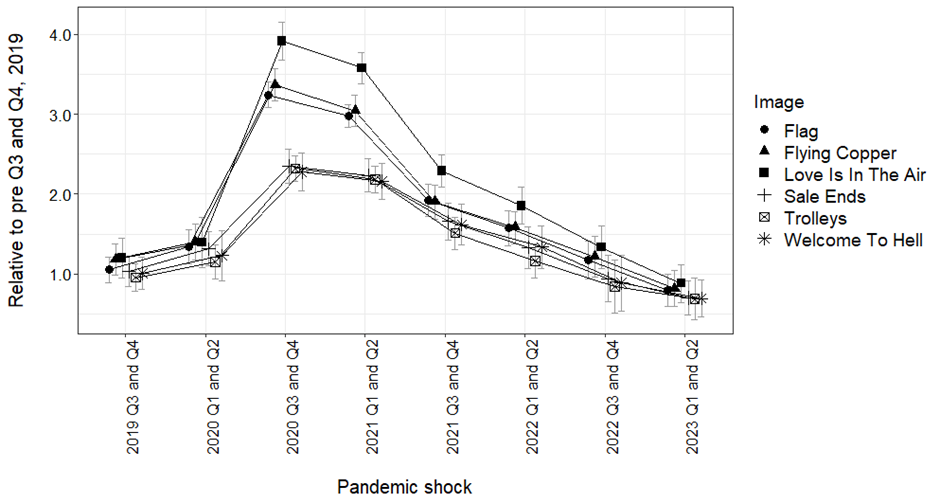
Some prints were affected more than others. The iconic ‘Flower Thrower’ (aka ‘Love is in the Air’) print nearly quadrupled in price at the peak of the bubble, whilst some more mainstream prints showed a more modest doubling in prices.
Banksy joins Warhol and Hirst with the dubious honour of having his own bubble.
It is the contention of the article that accompanies this piece that there was a bubble in the price of Banksy prints sold at auction during the COVID-19 pandemic and that the size of the bubble inflated prices to around 3 time their pre-pandemic levels. Prices had by early 2023 returned to the levels seen before the pandemic. The size of the bubble also varied by the print image.
Banksy has now joined other artists such as Warhol and Hirst with the dubious honour of having his own bubble, and he has lost his mystic that his works would always hold their value.
How do we lower the barriers to understanding sustainable diets?
It is well publicised that a societal shift towards a more sustainable diet would help to limit global warming, but how easy is it for individuals to understand what a more sustainable diet might look like in practice?
The Paris Agreement (UNFCCC, 2015) sets long term goals to guide all nations to substantially reduce global greenhouse gas emissions and to pursue efforts to limit global temperature increase to 1.5°C above pre-industrial levels, recognizing that this would significantly reduce the risks and impacts of climate change.
Recent research from CDRC’s Dr Susan Lee and colleagues from the Centre for Climate Change and Social Transformations, published in Frontiers in Sustainable Food Systems, explores how we can use complex data from Integrated Assessment Models (IAMs) to identify dietary shifts that align with these goals, then simplify through visualisation to help people make informed choices about possible lifestyle adjustments.
What is an Integrated Assessment Model?
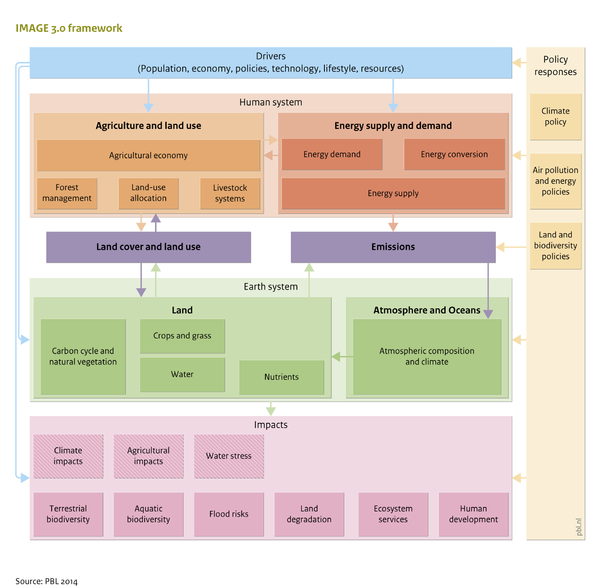
An Integrated Assessment Model (IAM), such as the IMAGE IAM used in this study, is a model that simulates interactions between climate, economy, society and the biosphere to evaluate climate change impacts and develop mitigation policies.
Traditional IAM outputs are incredibly useful to help us understand the impact of dietary shifts, but the complexity of the data and the need for detailed analysis can make them largely inaccessible beyond the research community.
Source: PBL 2014
This research explores how visualisation can be used to make these insights more accessible to both diet, nutrition, and sustainability professionals and the wider public.
Translating IAM outputs into accessible visualisations
The researchers systematically examined the impact of modelled changes in food demand on regional diets and dish visualisation.
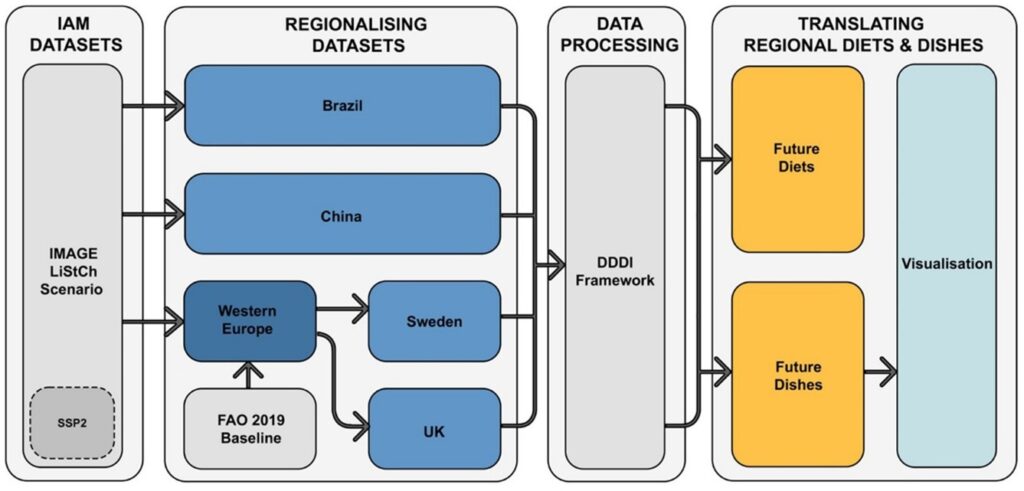
Their approach involved preparing and interpreting IAM scenario data, establishing food consumption baselines for Sweden, China the UK and Brazil and applying the Diets, Dishes, Dish Ingredients (DDDI) framework* to analyse shifts in food consumption patterns.
Methodology schematic representing the stages of Integrated Assessment Model (IAM) data processing and translating for the regional diets and dish visualisations.
Visualising current and potential dishes
They then worked with a designer to create proportional visual representations of current dishes and potential dishes for 2050 to highlight and better communicate the balance of plant and meat-based foods in potential future diets.
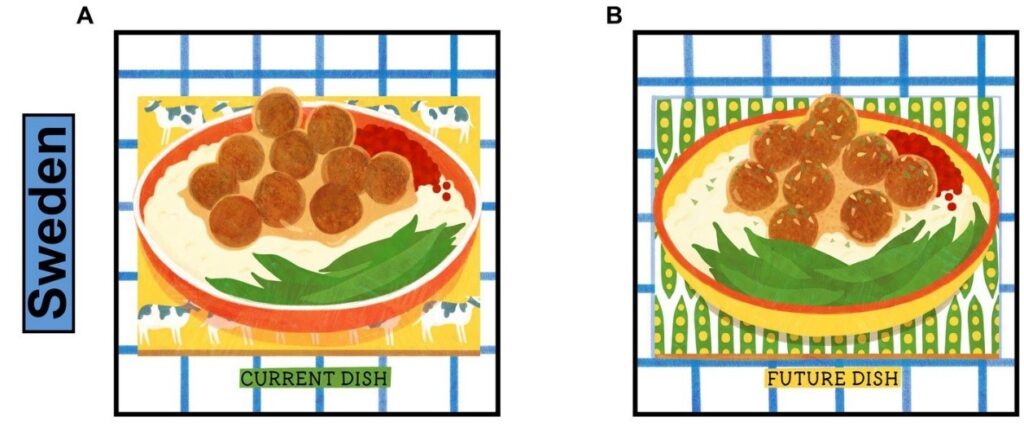
Sweden
Current dish: (Köttbullar) include meatballs comprising of beef and pork which are served with gravy, mashed potatoes, lingonberries, and green beans (A)
Future dish: Meat replaced by lentils, nuts, and seeds, while the proportion of vegetables expands to occupy half the dish by 2050 (B)
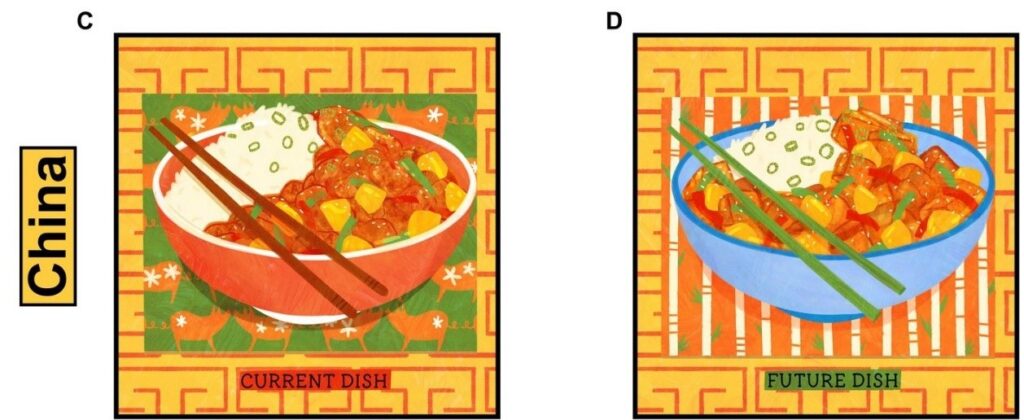
China
Current dish: Sweet and Sour Pork dish includes pork with pineapple, red and green peppers, and onions together with rice. (C)
Future dish: The pork is replaced by tofu (soy curd) (D)
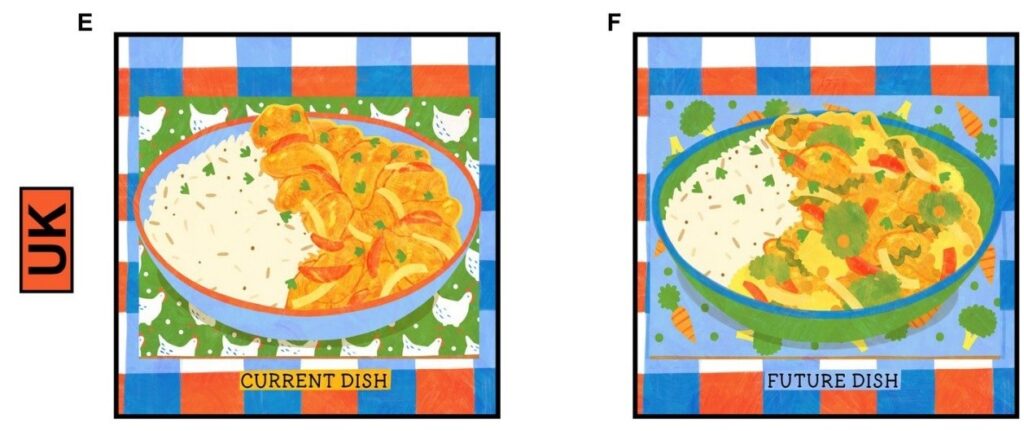
UK
Current dish: Chicken Korma consists of chicken, vegetables (onion, tomatoes, and a sprinkling of coriander) with rice (E)
Future dish: Chicken gradually replaced by pulses (chickpeas and lentils) with the introduction of broccoli to represent the increased vegetable proportion between 2020 and 2050 (F)
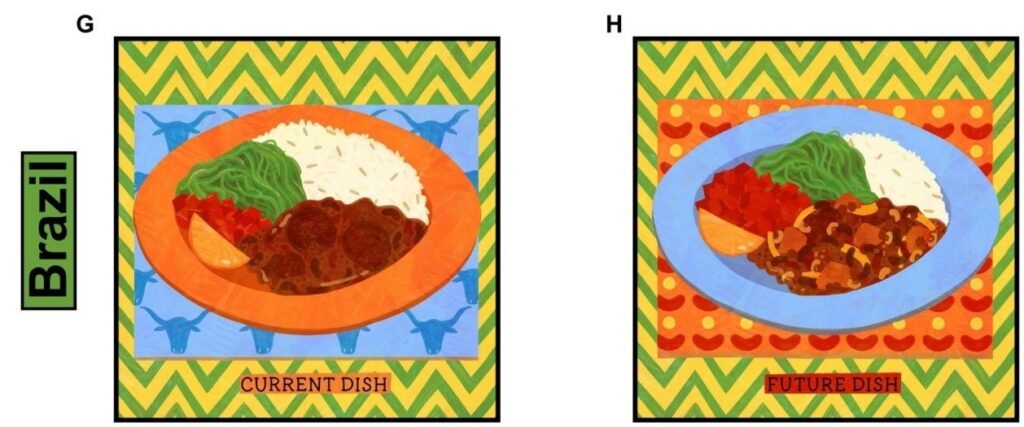
Brazil
Current dish: Feijoada – the dish consists of pork, beef, and beans, and is accompanied by a slice of orange, salsa, pan-fried collard beans (leafy vegetable) with garlic, and rice (G)
Future dish: The 2050’s dish includes sweet potato (considered a staple like rice) and black-eyed peas (pulses) (H).
Overcoming barriers through better communication
Whilst there is still more work to be done in this area, this study represents an effort to make complex dietary transition data more accessible.
Visualisations, like the ones shown above, could be used by diet, nutrition, and sustainability professionals to aid discussions around dietary changes with different communities.
Dr Susan Lee explains ‘We know that the shift in people’s diets will face barriers such as increased food costs, changes in habits and preferences, accessibility of plant-based foods and potential cultural and social barriers that may hinder the shift in diets to tackle climate change. However, the use of visual communication frameworks showcased in this research could help ease the transition to more sustainable diets within communities.’
*de Boer, J. and H. Aiking, Strategies towards healthy and sustainable protein consumption: A transition framework at the levels of diets, dishes, and dish ingredients. Food Quality and Preference, 2019. 73: p. 171-181.
The CDRC Open Data Science Bursary is available to anyone with a protected characteristic and/or limited income, and who is interested in attending more than one of the CDRC’s short courses in data science.
Applications are currently open for the remainder of the 2023/2024 academic year.
The short courses have hosted over 1,200 attendees since being launched in 2016; and were recently accredited by CPD UK. Each course is offered at least once annually; and takes place over half a day, one day or two days. Courses are currently offered in:
Beginners Python for Data Analytics (2-day course)
Intermediate Python (2-day course)
Tableau workshop on data visualisation (1 day course)
Spatial Analysis for Public Health Researchers (1 day course)
Introduction to QGIS (1 day course)
Introduction to R (half day course)
Intermediate R (1 day course)
Geocomputation and Data Analysis with R (2-day course)
How to apply
For any questions or further information on the bursary programme please contact us at [email protected].
Individuals interested in being considered for the Bursary are invited to complete an application form and send this too us at [email protected].
As part of the international research-intensive University of Leeds, we at the CDRC welcome data science training delegates from all walks of life and from across the world. We foster an inclusive environment where all can flourish and prosper, and we are proud of our strong commitment to data-science capacity-building.
We are dedicated to diversifying both our local and the broader data science community. We welcome the unique contributions that individuals can bring, and particularly encourage applications from, but not limited to: women; people who belong to a minority ethnic community; people who identify as LGBT+; and people with disabilities. Applicants’ cases will in any event always be considered individually, and on merit.
Key facts
Deadline
Rolling deadline; we encourage application as soon as possible in order to attend courses within this academic year.
Number of funding places
Multiple opportunities available
Country eligibility
International (open to all nationalities, including the UK)
Eligible costs
Course enrolment fees (for a minimum of 2 and up to a maximum of 4 courses)
Priority Places for Food – examples of high-priority neighbourhoods across England, Wales, and Scotland
The Priority Places for Food Index (PPFI), developed as a collaboration between the Consumer Data Research Centre (CDRC) and Which?, was launched in 2022 to identify neighbourhoods that are most vulnerable to increases in the cost of living and which are likely to be food insecure.
In January 2024 we launched Version 2 of the index, providing the most up-to-date picture of food insecurity risk at neighbourhood level.
In this post, Dr Fran Pontin and Dr Rachel Oldroyd highlight diverse examples of high-priority neighbourhoods across England, Wales, and Scotland, illustrating how various factors and barriers can converge to create a ‘perfect storm,’ resulting in households experiencing hunger or being unable to access a balanced, healthy diet.
For instance, there may be areas where families with young children are facing financial struggles and dealing with escalating food costs, leading them to turn to food banks to ensure their children are warm and well-fed.
Or, in rural areas where people have limited access to cars and poor local public transport, the ability to choose from a variety of food options and find the best deals is constrained. This limitation forces residents to rely on often more expensive convenience stores with a restricted selection of healthy and budget-friendly items.
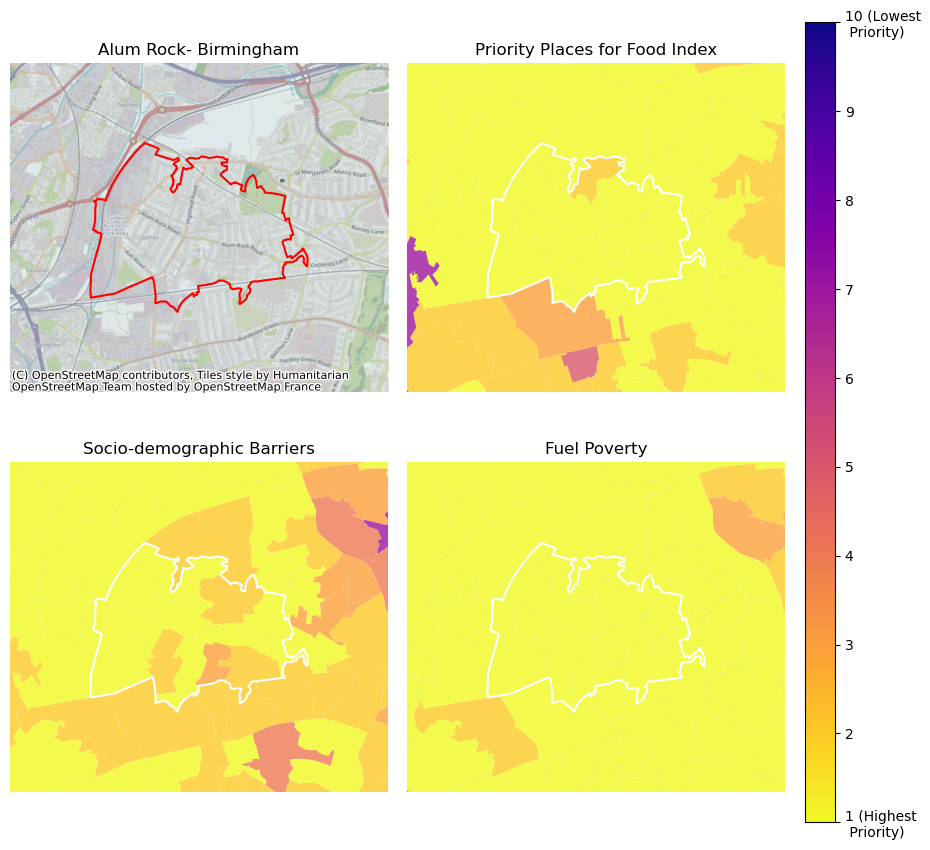
Alum Rock – Birmingham
Situated to the east of the city centre, Alum Rock is one of the most deprived wards in Birmingham, where 100% of the neighbourhoods in this area are classified as high priority places for food. This area has a young demographic, with 21% of the population aged 15 or under.
Therefore, presence of families and a related demand for family food support is particularly pronounced. Alum Rock is one of Birmingham’s most economically disadvantaged areas, with employment rates significantly below the city average.
Despite the presence of several supermarkets and convenience stores in the area, residents are likely to encounter substantial socio-economic barriers when attempting to access nutritious and healthy food. Moreover, this area reports high levels of fuel poverty, forcing many individuals to make difficult choices between heating and eating.
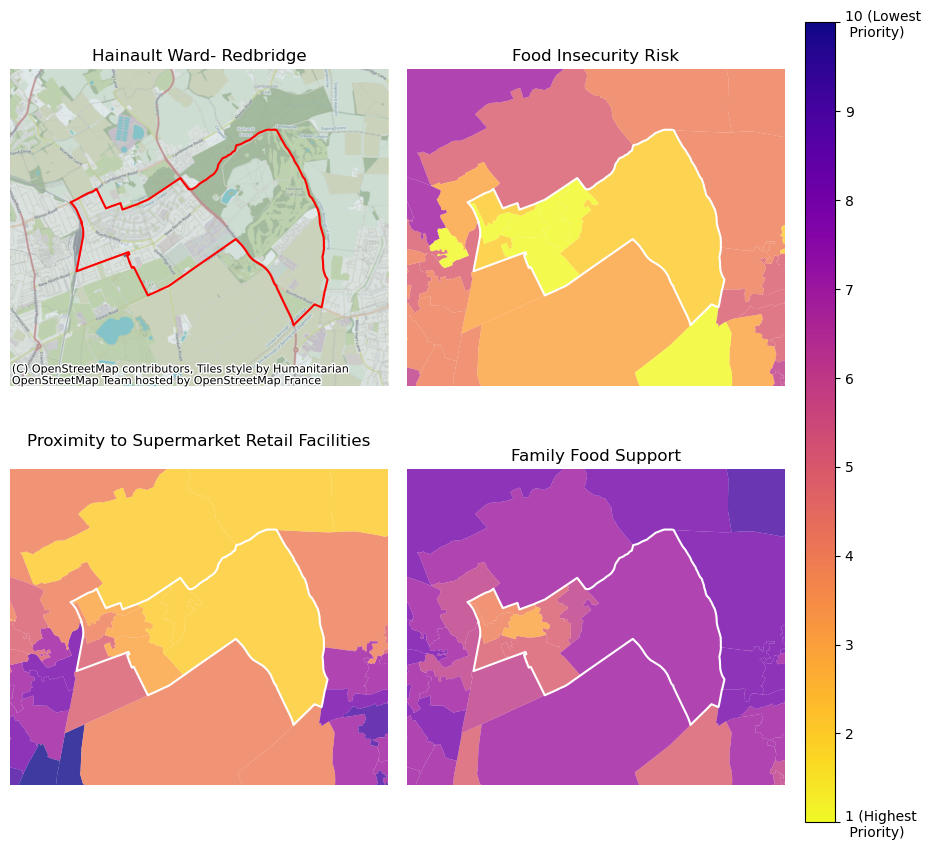
Hainault – Redbridge
Hainault is a good example of a ward where no one neighbourhood is the absolute highest priority within a specific PPFI domain when compared with the rest of England.
Here, neighbourhoods rank around the top 30-40% most in need across all the Priority Places domains. When considered in combination, however, these relatively high socio-economic risk factors paired with relatively poor access to purchase food contribute to high risk in food insecurity.
Compared to the borough population at the previous census in 2011, Redbridge has seen an increase in the proportion of families with children, more adults working shorter hours, increased population density and an increase in the number of people renting in the 2021 census.
This means by updating the data included in the Priority Places for Food Index, as new data comes available, we have captured these local area changes to give the most informed picture of food insecurity risk.
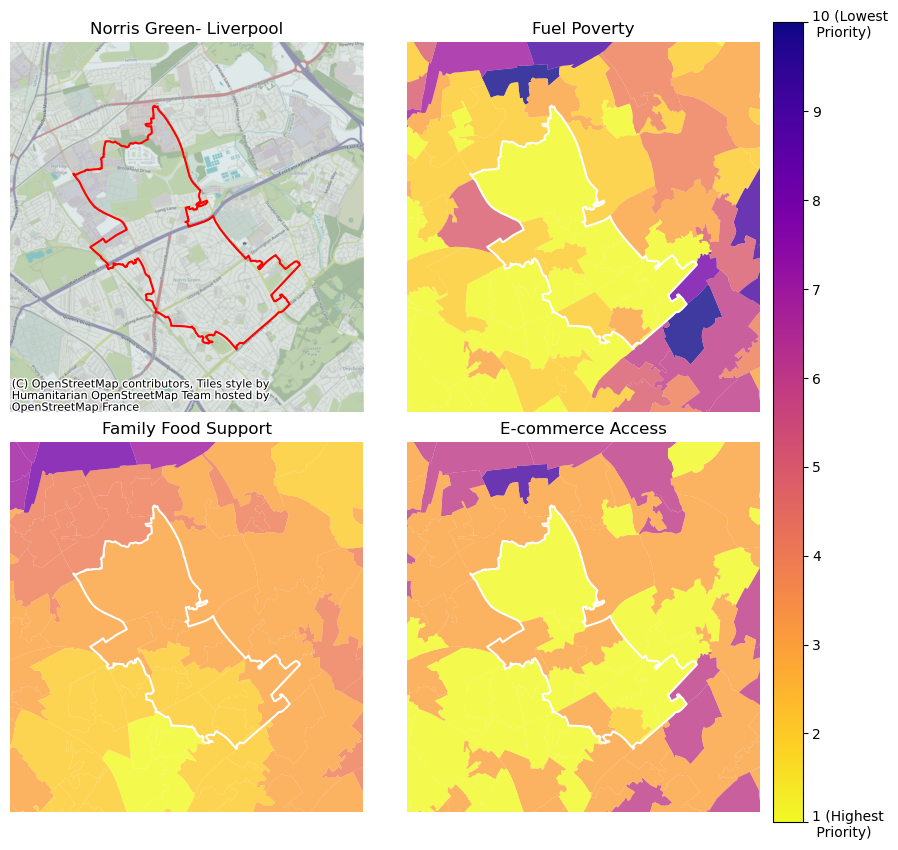
Norris Green – Liverpool
In the ward of Norris Green, Liverpool, all neighbourhoods bar one are in the top 20% of priority places across England and in need of support with food.
The ward of Norris Green demonstrates where socio-economic barriers paired with heating cost demands and reliance on additional food support have resulted in increased food insecurity risk.
We also see a discrepancy between fairly good proximity to supermarkets (i.e. there are lots of supermarkets nearby) but access to supermarket food via public transport or online delivery service is significantly poorer, suggesting that improving access to what is already there could be of benefit to this community.
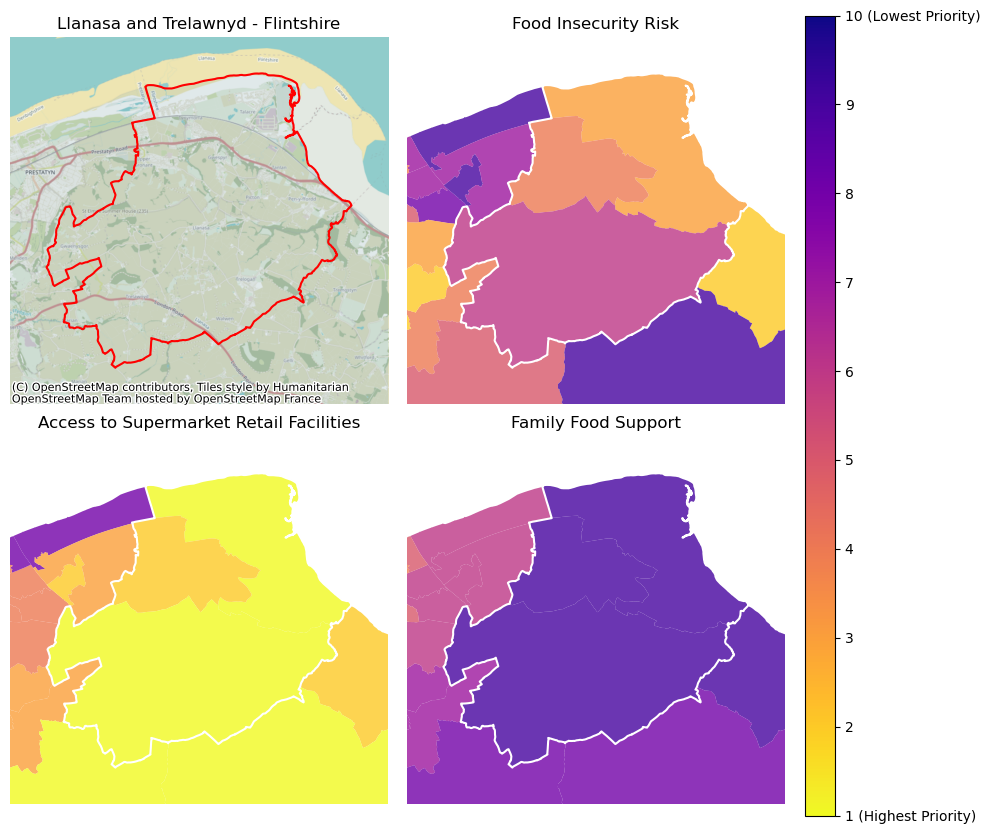
Llanasa and Trelawnyd – North Wales
In the ward of Llanasa and Trelawnyd in North Wales we see a good example of the importance of considering the domains in different population contexts.
The ward overall is not particularly high priority compared to Wales as a whole (in the top 30-60%). However, access to both supermarket and non-supermarket food is poor due to limited outlets in the local area. This ward has a large population of older adults so this poor access to food choice risks becoming a barrier to healthy and affordable food for these groups.
Conversely, we see less reliance on family food support as there are fewer school aged children (compared to Wales on average).
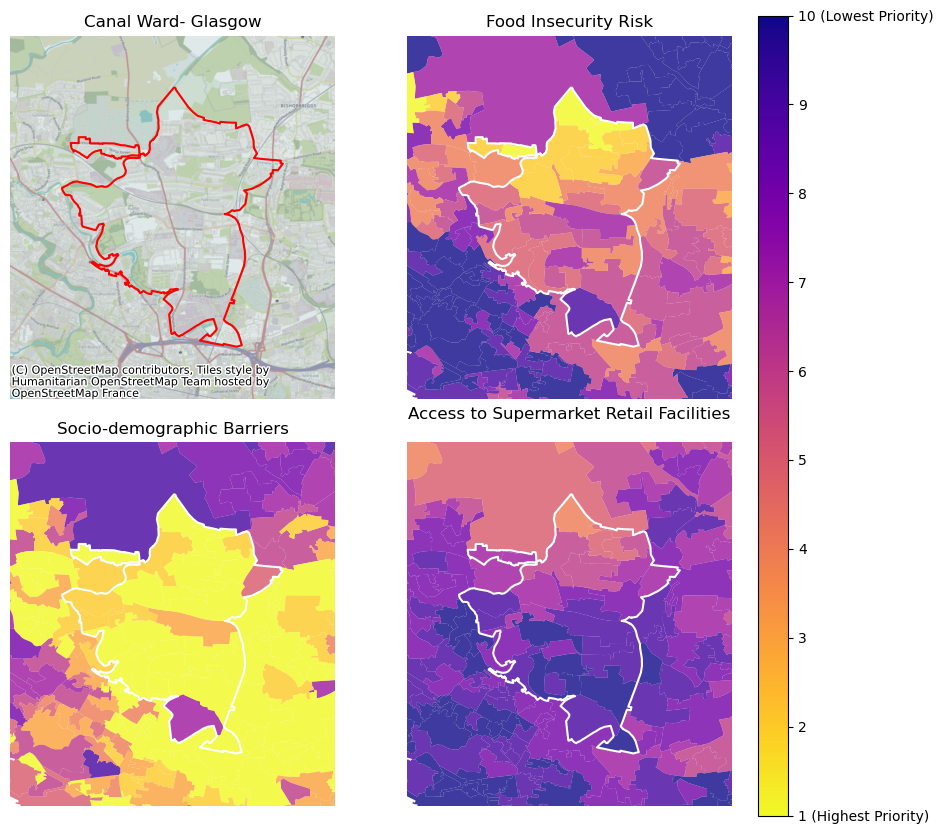
Canal Ward – Glasgow
In the Canal Ward of Glasgow, we see that some domains, such as the need for family food support are high across the ward whilst others such as socio-demographic barriers and access to supermarkets vary by neighbourhood. For example, towards the south of the Canal ward, towards Glasgow city centre, sociodemographic barriers are lower and access to supermarkets is better, making this neighbourhood a lower priority place compared to the rest of the ward, illustrating how the factors combine to make an area high priority.
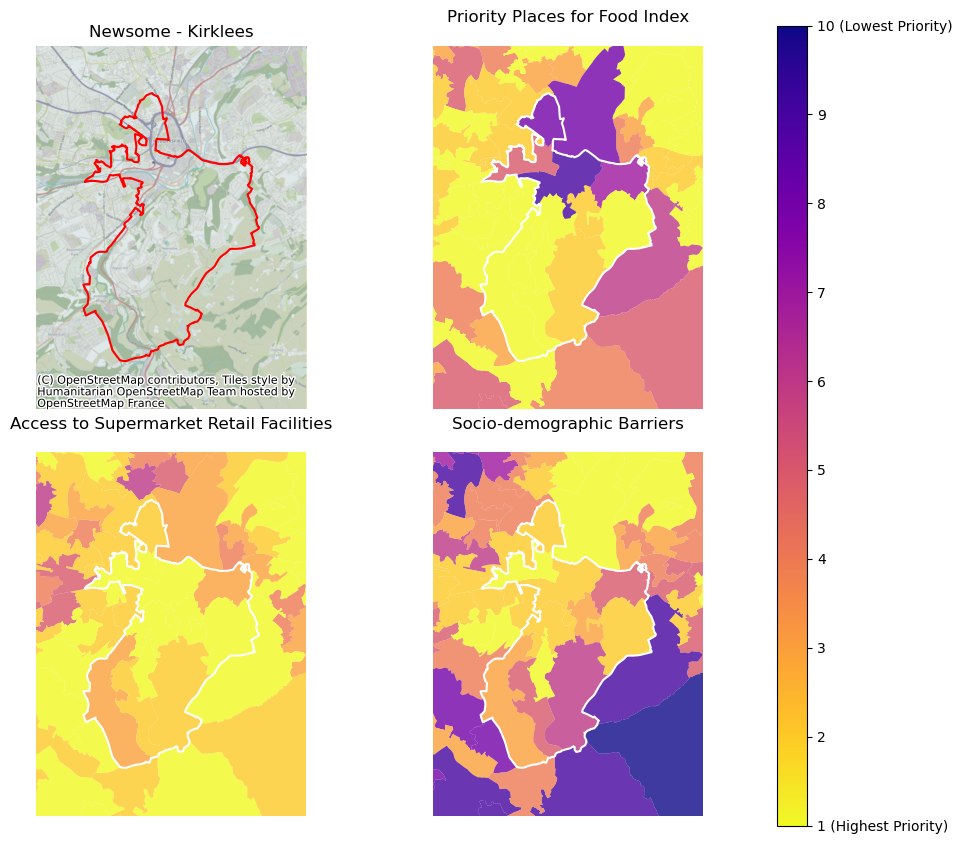
Newsome – Kirklees
Newsome, located to the South of Huddersfield town centre in Kirklees, is a good example of a traditional ‘food desert’ as 81% of the neighbourhoods in this ward have limited supermarket access.
Compared to other areas, the average distance to a supermarket and the average time taken to travel to a supermarket from this area via public transport is high. 40% of households in the area do not have access to a car or van so might find themselves struggling due to the lack of accessible supermarkets.
Compared to other priority areas, Newsome has lower need for family food support, and socio-demographic barriers do not contribute as much to the area’s level of priority for support.
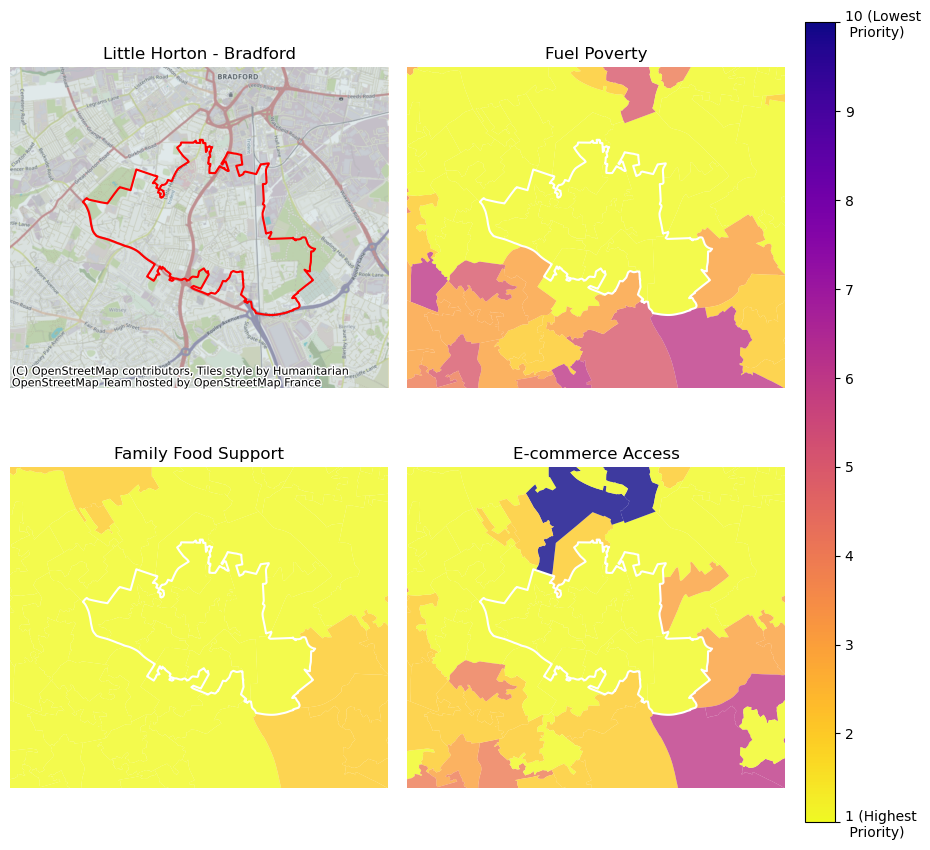
Little Horton – Bradford
Little Horton, to the South of Bradford City centre, is the second most deprived ward in the city.
Therefore, unsurprisingly, we note substantial socioeconomic barriers which limit access to healthy and nutritious food.
Little Horton has the highest percentage of children aged under 16 compared to other areas in Bradford and the need for family food support is high.
We see elevated levels of fuel poverty compared to other areas, and unemployment currently lies at 30%, well above the national average of 4.3%.
Little Horton is also an area of priority for ecommerce, so residents may struggle to buy groceries online, which is problematic for people who are unable to travel to the supermarket.
Eilean a’cheo – Scottish Highlands
Eilean a’cheo is a ward located in the Highland of Scotland and includes the islands of Skye and Raasay.
All 13 of the neighbourhoods within this ward fall within the highest priority places for supermarket proximity due to their remote location.
Residents of Eilean a’cheo are likely to face barriers accessing food due to the distance to the nearest supermarket.
Eilean a’cheo is also a priority area for ecommerce. Therefore, there may be difficulty obtaining online grocery deliveries compared to other areas.
How are you using the Priority Places for Food Index?
We’d love to hear how you are using the Priority Places for Food Index to better understand food insecurity risk in your area.
We always welcome suggestions from those using the tool to make it as useful as possible – please do get in touch with the CDRC Leeds team if you have any questions or recommendations.
Podcast: Achieving impact as an Early Career Researcher
Last month our Nutrition and Lifestyle Analytics Team were awarded a Celebrating Impact Prize from the Economic and Social Research Council for the work they are doing to improve access to healthy and sustainable diets for customers of major food retailers.
Two members of that team, Dr Vicki Jenneson ANutr and Dr Francesca Pontin, join Ged Hall on this week’s Research Culture Uncovered podcast to discuss their careers to date and how, as part of the CDT Data Analytics & Society and the Consumer Data Research Centre , they have been engaging with partners to deliver impact.
🎧 A great listen for other Early Career Researchers looking to build impact into their academic identities: https://lnkd.in/g3us4AKr
New Data: Which? Priority Places for Insulation Index
In November 2023 Which? released the Priority Places for Insulation Index which shows places around the UK which are most in need of insulation.
In partnership with Which? the Priority Places for Insulation Index data is now available to researchers via CDRC Data.
The index is novel because it incorporates both aspects of housing stock and household circumstances which exacerbate the need for insulation.
It is a composite index which considers the condition of properties in each area, as well as features of the local population including age, level of fuel poverty, and health conditions.
The index ranks geographical areas within each nation of the UK across eight different indicators relating to insulation needs and is produced by weighting and combining the eight indicators to construct an overall ranking of Priority Places for Insulation within each nation. It has been produced at three levels: local authorities, parliamentary constituencies and small local areas.
It was constructed using open data and web-scraped data from the publicly accessible Energy Performance Certificate (EPC) register for Northern Ireland as well as relevant sites where installers can be found or listed.
More Information on the Priority Places for Insulation Index
CDRC in Parliament – Fairness in the UK’s food supply chain
Earlier this month Dr Francesca Pontin, CDRC Research Data Scientist at the University of Leeds, gave evidence to the Environment, Food and Rural Affairs Committee on ‘Fairness in the food supply’.
Fran provided insight from CDRC-Leeds’ Priority Places for Food Index and the teams wider research. We asked her to share a little bit more about the index and some of the key insights from the committee:
About the Priority Places for Food Index
The Priority Places for Food Index (PPFI), developed last year in collaboration with Which?, identifies areas within the UK at risk of food insecurity.
Policymakers can use the interactive map to identify neighbourhoods most in need of support and to understand the main reasons that they need this support.
Transport is part of the problem, and the solution
Household access to a car can be a serious limitation for consumers when it comes to accessing affordable food – not only do they have difficulties reaching food retailers in general, but they are also unable to conveniently shop around for deals, choose cheaper food retailers or ‘bulk buy’ in a way that could minimise cost.
PPFI includes data on household car access and access and availability to public transport. The length of a journey via public transport is part of how we generate our ‘Accessibility to supermarket retail facilities’ data domain. Household access to a car is measured in the ‘Socio-economic barriers’ data domain.
Issues around transportation also look different whether you are in an urban or rural area. Increasing connectivity opens up consumer choice by making a variety of food retailers more accessible to larger portions of society.
Different solutions are needed for urban and rural areas
In rural locations, access to supermarkets often drives the risk of food insecurity. In these cases, meeting both transport need and availability (e.g. increasing local connectivity) would lower the risk of food insecurity.
Longer term, increasing the number of available supermarkets in rural areas would potentially minimise the distance needed to travel to reach those sources of food.
There is also an issue with rural food retailers potentially operating at a higher price point, especially where rural communities might rely significantly on convenience stores for the majority of their shopping. Mystery shopper research from Which? found supermarket-brand convenience stores do not stock budget-range groceries, though Morrisons has now committed to doing so in their Morrisons Daily convenience stores.
In urban areas, the primary drivers of food insecurity risk are typically socio-economic barriers. Shoppers may be able to access supermarkets more easily, but other markers of deprivation captured in the index, including income deprivation, fuel poverty and reliance on food ‘safety-nets’, limit their ability to purchase food.
Pushing health problems down the line
Not having access to adequate amounts of food or the right sources of food is not just a cost-of-living problem, it has far-reaching implications for the future burden placed on our health service.
Fran also highlighted that childhood attainment is one of the outcomes most likely to be impacted by food insecurity, as a lack of adequate nourishment for children makes it harder for them to concentrate in school.
A need for legislation
In October 2022 the Government introduced legislation which limits the sale of foods high in fat, salt, and sugar (HFSS) in key retail promotion locations within retail stores, over a certain size, selling food.
In this session the panel discussed how it is possible for legislation to drive change for businesses. Fran highlighted HFSS as an example of how sector-wide change can happen when it becomes a business priority, putting less burden on health and sustainability teams to make a business case for healthier and more sustainable product lines.
There is a clear need to respond to consumer concerns around food health, sustainability and pricing – and this is part of what PPFI and our ongoing work with Which? allows us to do – however Government legislation can provide an effective top-down approach to ensure businesses act.
The team are involved with the DIO-Food project, an academic evaluation of the impact of the HFSS legislation: whether it worked to reduce sales of HFSS items and whether it impacted communities equally. It will consider both the experience of consumers and retailers. This will allow us to continue making valuable suggestions to Government about what really works in retail settings.
Healthy start top-up vouchers and price incentives
The committee had a number of questions around price incentives on healthy products.
In response to these questions Fran highlighted research from the University of Leeds, in collaboration with IGD and Sainsbury’s in which analysis on a 2021 Healthy Start top-up scheme revealed that baskets redeeming a £2 top-up coupon purchased 13 more portions of fruit and vegetables compared to baskets where a voucher was not redeemed.
Fran also referenced a trial, undertaken in collaboration with IGD and Sainsbury’s which reduced the price of selected fruit and vegetables in stores across the country for four weeks and led to the number of promoted fruit and vegetables sold increasing by 78% during the intervention period.
Food sector data transparency
Academic research can only happen when data are made available for rigorous analysis.
Unfortunately, competition law and commercial sensitivity often limits what data retailers can share externally, including with researchers. Whilst the CDRC has worked hard to establish relationships with retailers to enable data sharing, there are still many challenges when it comes to sharing within the sector.
Whilst much of our work is with large retailers, we also know that smaller retailers such as independents and convenience stores can offer alternative insights. However, working with these retailers presents its own challenges, as they often do not have the internal resource to enable research development and relationships or to share data.
Ensuring food sector data transparency, for example through the Food Data Transparency Partnership would not only allow greater access to food data for analysis, but also create a non-competitive space where retailers could share learnings of what works to help customers. Legislation of this kind would level the playing field, and we would welcome convenience store retailers as part of that conversation.
Large overlap between food sustainability and cost-of-living initiatives
A recent trip to Good Food Oxfordshire, who are using the PPFI as a core metric in the Oxfordshire Food Strategy, highlighted how sustainability initiatives originally set up to minimise food waste have now had to pivot to also solving food insecurity during the cost-of-living crisis.
This has become a particular issue when large redistribution initiatives mean that surplus food is not being kept local but in fact being moved across the UK. Particularly relevant at the moment in light of the King’s The Coronation Food Project announcement, a project which aims to redistribute food surplus to the neediest areas.
It is becoming clear that sustainability initiatives alone are not sufficient to address food poverty, and that there needs to be greater attention paid to the barriers to accessing food, rather than the availability of food, either in retailers or in surplus.
A team of researchers from the Consumer Data Research Centre have been awarded an ESRC Celebrating Impact Prize in recognition of the work they are doing to improve access to healthy and sustainable diets for customers of major food retailers.
The Nutrition and Lifestyle Analytics Team, which is led by Professor Michelle Morris, collaborated with IGD and major retailers, including Asda and Sainsbury’s, to analyse data from shopping transactions and loyalty cards, and test interventions aimed at promoting healthy and sustainable diets.
Insights from the team, which included Dr Stephen Clark, Dr Emily Ennis, Dr Vicki Jenneston and Dr Francesca Pontin, have benefited individual food retailers by delivering evidence-based research about what works and, crucially, what doesn’t when it comes to encouraging consumer healthy behaviours.
“We are delighted that our research has delivered real world impact and to be recognised as winners by ESRC in this way is brilliant. Our work in the Business and Enterprise category has delivered impact within business but importantly to communities that are most in need of support to access healthy, sustainable, and affordable food. This work been a result of effort from a diverse team, at the University of Leeds and our partners. We hope that it inspires others to play their part in research that makes a difference.”
Prof Michelle Morris explains: “Traditionally, people’s dietary habits have been recorded through surveys reporting what they have eaten, but this provided limited data to inform national policies. Retailers were reluctant to share more valuable data about shopping patterns due to commercial sensitivities. This project enabled us to build industry relationships and gain access to data sources, such as loyalty cards.”
The research started in 2017 with a single supermarket partner. In 2020, the team was invited to collaborate with IGD, whose Industry Nutrition Strategy group (INSG) members represent more than 11,500 UK food stores, and account for over 90% of take-home food sales.
The partnership enabled the researchers to run a series of in-store and online behaviour change trials with four UK food retailers. The team worked with supermarket partners to change the in-store environment, experimenting with signposting, product placement and incentivisation. The team then analysed transaction records to understand which changes positively impacted purchasing patterns.
Hannah Skeggs, Senior Health & Sustainable Diets Manager, IGD said of the partnership: “It has been a privilege for IGD to partner with the Consumer Research Data Centre to evaluate real-life trials in supermarkets across the UK. Winning this award is a fantastic credit to the teams’ hard work, innovative data products and exceptional collaboration. We look forward to continuing our partnership together with the ambition of making healthy and sustainable diets, easy and accessible for everyone.”
Informing retail strategies
The team’s insights have changed how and what products are available from retailers, as well as enabling retailers to make informed cost-benefit analyses and economic decisions around how best to support their customers.
A trial changing the placement of meat alternatives at Asda, for example, resulted in a decrease in sales. The company has committed to expanding their vegan range by approximately 50% and are exploring which interventions will influence shoppers to make more meat-free choices.
Beth Fowler, Nutrition & Health Strategy Manager at Asda, commented: “Our collaboration with Professor Morris and the Consumer Data Research Centre team has enabled Asda to test and understand the impact of merchandising on consumer food choice, in a real-world supermarket setting. Their expert insights were used to scope, shape, implement and evaluate the trial.
“Using the data and results from the trials we ran with Professor Morris’ team, we have been able to influence decision-making within the business to ensure our Plant Based range of alternatives to meat are accessible for customers.”
Shifting shopping patterns
The introduction of interventions that shift shopping patterns towards healthier diets means consumers have also benefited from the team’s research. The work led to sector wide transformations, providing insights to retailers on the effectiveness of behaviour-change trials that encourage healthy and sustainable diets, particularly for communities most in need.
For example, the team analysed how effective the Sainsbury’s Healthy Start voucher top-up scheme had been in supporting pregnant women and children with access to healthy nutrition. Analysis showed that shoppers increased the number of fruit and vegetables in their baskets by an average of 13 more portions and bought more products in line with the Eatwell Guide.
Nilani Sritharan, Group Head of Healthy & Sustainable Diets for Sainsbury’s explained: ‘Sainsbury’s experience of working with Michelle and her team has been excellent. They have pushed boundaries in how the food industry collaborates with academia and influenced business decisions within Sainsbury’s and choices available to our customers.
Using the data and results from the trials we ran with Michelle’s team, we have been able to influence commercial decisions within the business related to expanding the top-up scheme for Healthy Start Vouchers and the pricing of fruit and vegetables through Nectar Prices and Aldi Price Match.”
Future work
Through co-production of research, we have demonstrated to the retail sector the depth of academic insight available and shown academic researchers the value of industry expertise in delivering true and lasting real-world change.
Our research team’s reputation for robust data governance has made retailers feel confident in both sharing our insights and best practice across the sector and advocating for other retailers to be part of our collaboration.
This collaboration is ongoing, and we are excited about the possibility of future trials with current and new partners in the food system. In addition to trials the Nutrition and Lifestyle Analytics team will be using retail transaction data to evaluate the impact of nationals policies, such as the government legislation to restrict promotion of foods and non-alcoholic beverages high in saturated fat, salt and sugar.
Michelle discussed the role that access plays in food poverty and how policy makers can use the CDRC’s Priority Places for Food Index (developed in collaboration with Which?) to identify neighbourhoods that are most vulnerable to increases in the cost of living and which have a lack of accessibility to cheap, healthy, and sustainable sources of food.
Dr Effie Papargyropoulou and Prof Sara Gonzalez discussed how traditional markets and community-led food initiatives can help remove some of the barriers to food access and are supporting some of those communities struggling with food insecurity.